Highlights
- Aquatic macroinvertebrates—insects and other creatures that live in the stream bottom—feed trout and are the basis of fly-fishing on the Henry’s Fork, but they are also important indicators of aquatic habitat quality.
- HFF is two years into a long-term program of monitoring aquatic macroinvertebrates at Flatrock, Last Chance, Osborne Bridge, Ashton, and St. Anthony.
- Primary conclusions from comparison of 2015 and 2016 data are:
- Abundance of macroinvertebrates averages about 47,000 individuals per square meter of stream bottom across all sites.
- Mayflies, stoneflies and caddisflies dominate the invertebrate assemblage at Flatrock, Last Chance, and Ashton, but are outnumbered by other organisms at Osborne and St. Anthony.
- Aquatic habitat quality ranges from excellent at Flatrock to good at St. Anthony, decreasing with distance downstream from the headwaters.
- The only statistically significant differences between 2015 and 2016 occurred at Osborne Bridge, where total abundance of invertebrates decreased—primarily because of a decrease in non-insects—and where habitat-quality index increased, reflecting an increase in percentage of mayflies, stoneflies, and caddisflies.
- Most of the mayflies and stoneflies important to fly anglers were found at all five sites. These were pale morning dun, flav, blue-winged olive, green drake, trico, brown drake, and yellow sally.
What is an aquatic “macroinvertebrate?”
As we all learned in high school biology, invertebrates are organisms that lack a vertebral column or “spine”. They include familiar organisms such as insects, worms, crustaceans (crabs, shrimp), and mollusks (clams, snails). Around 97% of all animal species are invertebrates; we vertebrates are definitely in the minority! “Aquatic” invertebrates, then, are invertebrates that live in aquatic environments such as streams and lakes. An aquatic “macroinvertebrate” is one that can be seen with the naked eye. Insects, leeches, worms, snails, and freshwater shrimp are all common aquatic macroinvertebrates that occur in trout streams.
What does “taxa” mean?
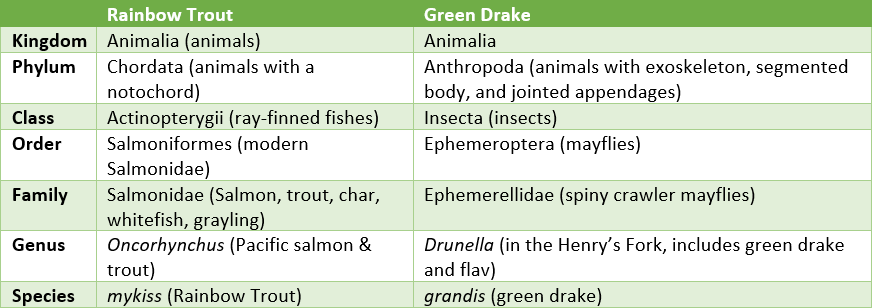
I also still remember the mnemonic “Kings Play Checkers On Funny Green Squares” from high school biology as a way to remember the hierarchy of taxonomic classification of organisms: Kingdom, Phylum, Class, Order, Family, Genus, Species. This classification system is the way “scientific” or “Latin” names are assigned to organisms in a precise manner so that scientists always know what organism they are talking about. Common names are not as reliable for identifying organisms because some species have multiple common names (for example Mackinaw and Lake Trout apply to the same species), and some common names apply to multiple types of organisms (for example “perch” refers to members of the perch family but is also used as a common name for some sunfishes). As a reminder of how this works, the table below gives the classification of two important organisms in the Henry’s Fork. Those of you who have been associated with these two organisms for many decades know that taxonomy is fluid—rainbow trout used to be Salmo gairdnerii, and the green drake used to be Ephemerella grandis. Changes in taxonomy occur as new scientific and historical information is discovered.
Ideally, all macroinvertebrates would be identified to species, but that is not always possible from samples taken from the stream bottom, given the small size of most individuals and difficulty in distinguishing among closely related species without additional information. Thus, some aquatic organisms are identified to species, others to genus, and others only to family. To be precise, then, we can’t always refer to “species” in results of macroinvertebrate sampling and instead refer to “taxa,” which is the plural of “taxon” and refers to the lowest classification level used in the reporting and analysis of the sample. For example, when we say that a sample contained 32 taxa, that might mean 20 different species, and additional 10 different types identified only to genus, and 2 more identified only to family. In reality, this is at least 32 different species, since each genus and family could be represented by more than one species.
Why monitor macroinvertebrates?
Aquatic macroinvertebrates are the workhorses of aquatic ecosystems. They convert primary energy sources such as plants and algae into trout food, providing the majority of the diets of young trout. Although large trout—especially brown trout—can get a large fraction of their energy from vertebrate prey such as small rodents and fish, in the Henry’s Fork, even adult trout continue to feed primarily on invertebrates. Of course, without aquatic invertebrates, fly fishing would be a completely different activity. Although many popular fly patterns imitate vertebrates and terrestrial insects, the majority of trout fly patterns imitate the various life stages of aquatic invertebrates, primarily mayflies, stoneflies, and caddisflies. As it turns out, these insects are indicators of water quality and overall health of the aquatic ecosystem because most species of mayflies, stoneflies and caddisflies are sensitive to water pollution and habitat degradation. In fact, this group is so important in the assessment of water and habitat quality that it has its own acronym among aquatic ecologists—EPT. This acronym is short for the three taxonomic orders Ephemeroptera (mayflies), Plecoptera (stoneflies), and Trichoptera (caddisflies). Higher relative abundance of EPT taxa indicates better water and aquatic habitat quality. Several other quantitative measures calculated from the relative abundance of different taxa complement the EPT percentage to provide indexes of the quality of aquatic habitat. Although HFF maintains an extensive network of water-quality monitoring equipment throughout the watershed, water quality measurements give us data only on the physical and chemical composition of the water itself and not on the quality and quantity of aquatic habitat. Aquatic invertebrates integrate habitat quality and water quality to indicate the overall quality of aquatic ecosystems. Because of this, monitoring of aquatic macroinvertebrates has become the standard method for government agencies, scientists, and organizations like HFF to keep track of trends in aquatic ecosystem health.
What macroinvertebrate monitoring CANNOT tell us
Many aquatic macroinvertebrates, such as leeches, worms, and snails, spend their entire lives in the water. Others, such as most aquatic insects, have both an aquatic and a terrestrial life stage. In fact, the adult stage of common mayflies, stoneflies, and caddisflies provides the most sought-after angling opportunities on the Henry’s Fork—the chance to catch a trout on a dry fly. However, the adult stage of all aquatic insects is very brief compared to the aquatic stage—a few hours to days on land compared with months to years on the stream bottom. As a result, effective sampling of aquatic macroinvertebrates and use of macroinvertebrate measures to tell us about habitat quality relies on sampling the invertebrates while they are in the river—not in the air. That is, aquatic insects are sampled as nymphs or larvae, not as adults. Therefore, the analysis of aquatic macroinvertebrates does NOT tell us anything about a particular hatch of adult insects from a fishing standpoint, especially on any particular day or location in the river. In general, the fishing-related aspects of adult insect hatches are only very loosely related to abundance of the aquatic (nymph) stages and depend on a lot of other factors such as weather, streamflow, fish behavior, and water clarity.
So, I can only describe our aquatic invertebrate sampling and what it tells us about overall aquatic habitat quality; knowing full well that what I report will contradict the personal fishing experience of many anglers. This is because, as explained above, the aquatic invertebrate analysis provides information on aquatic habitat quality, and does NOT reflect hatches of adult insects from a fishing standpoint. This certainly won’t be the first time that what I report from a scientific standpoint is inconsistent with angler experience on the river. More on this in a future blog.
HFF’s Macroinvertebrate Monitoring Program
The previous section described “why” we monitor macroinvertebrates. Now we describe the “who”, “when,” “where,” “how,” and “what.”
Who
HFF staff and interns collect the invertebrate samples, under direction of Brett Marshall, an experienced invertebrate biologist who runs a company called River Contiuum Concepts in Bozeman. Brett has been known as “The Bug Guy” for over two decades and is a national authority on aquatic invertebrates. His consulting firm specializes in assessment of aquatic ecosystems. Brett and his team process the samples and provide the data to HFF. Brett also maintains a “master list” of all aquatic invertebrates HFF and its partners have ever found in the Henry’s Fork Watershed, updating scientific names as necessary to keep pace with advances in identification and taxonomic classification. HFF staff then use statistical methods to analyze the data.
When
Most aquatic invertebrates have a well-defined life history driven by seasonal patterns in day length, water temperature, streamflow, and other environmental factors. Other than midges, which hatch and reproduce year-round, most aquatic insects in the Henry’s Fork hatch and reproduce during the spring, summer and fall—roughly between the middle of March and early November. In addition, most of the common EPT taxa have a one-year life cycle, meaning that immediately after hatch of a particular insect, that species is represented on the stream bottom only by eggs or very young individuals, which are too small to be sampled and counted. For example, if we sampled in early July, we would be very unlikely to capture any green drakes in our sample, because this year’s cohort would have just hatched, and next year’s are still in the egg stage. Thus, the best time to sample invertebrates on the Henry’s Fork is in the middle of March, immediately prior to the beginning of the spring hatches, when almost all species are at nymph stages that are large enough to be captured and counted. In the first two years of our current sampling program, we collected invertebrates on March 17, 2015 and on March 17, 2016. We will continue to sample at this time each year in order to obtain the most complete sample of all species in a consistent manner.
Where
Based on a variety of scientific, logistical, and resource (time and money) constraints, we selected five sites on the mainstem Henry’s Fork at which to conduct annual invertebrate analysis. The five sites are shown on the map below. The Flatrock site is located upstream of Island Park Dam and represents conditions in the headwaters of the river, where effects of dams, diversions, agriculture, and other land uses are minimal. That’s not to say that the Flatrock site is unaffected by land uses upstream and by water management at Henry’s Lake, but cumulative upstream effects of land and water use are minimal at Flatrock compared with points farther downstream. The Last Chance site is in a reach of river that is greatly affected by management of Island Park Dam and is also at a geologic transition, where the river has emerged from Box Canyon but has not yet entered Harriman State Park. Most invertebrate taxa found in Box Canyon and the upper reaches of Harriman are also found at Last Chance. The Osborne Bridge site is representative of the lower Ranch and Harriman East, where the river gradient is lower and substrate is finer (silt, sand, and fine gravel at Osborne versus gravel and cobbles at Last Chance). The Ashton site is immediately upstream of Ashton Reservoir and so is affected by Island Park Dam but also by the inflow of Warm River, which is the most pristine of any of the major tributaries to the Henry’s Fork. Among the sampling five sites, St. Anthony reflects the greatest cumulative effects of upstream uses of the river and its tributaries. The St. Anthony site is downstream of four reservoirs, five hydroelectric power plants, dozens of major highway and county-road bridges, 19 canal diversion points, and hundreds of square miles of agricultural land.
How
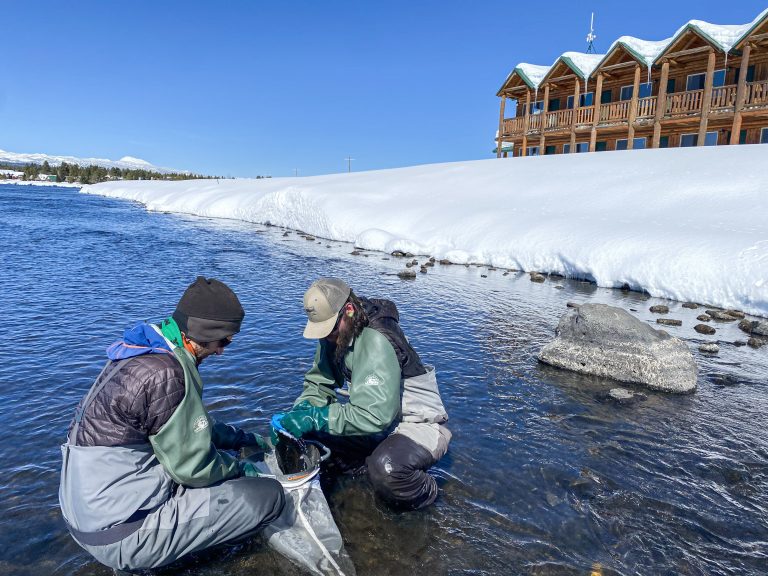
Invertebrates are collected using what is called a Hess sampler, which is basically an open aluminum drum that is pushed down into the stream bottom. The substrate on the bottom of the stream is then vigorously stirred to free the invertebrates living there. The drum has a screened opening on one side that allows water to flow into the sampler, and a mesh net across from the opening captures the invertebrates as they are stirred up from the bottom and flow into the net. All large rocks that are present within the area sampled by the drum are manually cleaned with a brush to make sure all invertebrates (especially case-making caddisflies) are scraped into the sampler. The drum has a known area so that the number of invertebrates in the sample can be extrapolated to abundance per square meter of stream bottom. We collect multiple samples at each site to account for variability across the stream bottom. In 2015, we collected three samples per site; in 2016 we collected five per site. A larger number of samples reduces uncertainty and increases statistical power to detect changes across years and sites.
Each sample is emptied out of the net and into a plastic jar and then preserved with alcohol. At Brett’s lab, the sample is cleaned and sorted, to separate the invertebrates from sand, gravel, and plant material. Individual invertebrates are then identified and counted. In samples from the Henry’s Fork, which contain very large numbers individuals, only a subsample of each full sample is used for counting and identification. Brett aims for identification of about 200 individual invertebrates from each sample, and he uses a strict quality-control procedure. After a sample is processed, a second technician sorts the sample to validate the result of the first technician. If there are discrepancies, a third person examines the sample. As a result, Brett’s lab is known for providing the highest level of accuracy and precision in quantitative analysis of invertebrates; he consistently finds more small organisms in samples than is the standard in the industry.
What
Brett’s lab reports raw data, which consists of the number of each identified taxon present in each sample. He also reports summary data such as total number of individuals per sample, number of different taxa, number individuals in the sample from the EPT taxa, and various indicator metrics. We have focused on four different metrics:
- Abundance (number of individuals per square meter of stream bottom)
- Shannon’s diversity index (higher diversity means more individuals spread across a larger number of different taxa)
- Percent EPT (fraction of total number of individuals that are mayflies, stoneflies, and caddisflies), and
- Hilsenhoff Biotic Index (a measure of habitat and water quality)
We statistically analyze the data Brett provides us to look for trends across years and sites.