By Christina Morrisett and Rob Van Kirk
During the Thanksgiving Holiday, we received a number of calls from concerned anglers about low flows and ice formation on the Henry’s Fork downstream of Island Park Dam. There is no question about it—flows are low; that’s not unexpected following the driest water year since 1941 (see previous blogs and newsletters for details). However, flows are higher than expected given how dry it is, and temperatures have actually been fairly mild compared to other winters when flows were low.
But, your questions and concerns motivated us to dig into the scientific literature and data and provide information on relationships among winter flow, temperature, and trout survival on the Henry’s Fork. We spent most of this week putting together some information we hope will help answer questions and ease fears about the combined effects of low flows and cold temperatures on trout survival in the Henry’s Fork.
Our road-map for this extensive blog post is:
- Basic aspects of winter trout ecology.
- Winter ecology of trout in the Caldera reach of the Henry’s Fork.
- Relationship between winter flow and the size of the wild trout population in this reach of the river.
- Procedure used to determine management of Island Park Reservoir in the winter.
- River flows during the winter of 2015-2016.
- Temperature during last week’s cold spell and projections for the winter of 2015-2016.
And, if you do not have time to read the entire post, here is a summary of our primary conclusions.
Summary
- While the combination of flow and temperature that resulted in last week’s icing event was below average, it was not extreme in either magnitude or duration and should have little if any effect on the trout population.
- Winter flow is going to be much lower than average this year but nowhere near what would be expected based on the extreme drought we are experiencing.
- Although it is impossible to quantify how much water was used or saved by every single management decision and weather event that happened during 2015, extremely precise management and informed decision-making around the Chester turbine flow test increased winter flows by a whopping 34%, increasing projected trout recruitment in 2017 by 18%.
Read on to see how we came up with these!
The basics of winter trout ecology
Trout are what biologists call poikilotherms or ectotherms, meaning that trout cannot regulate their own body temperatures. Thus, their body temperature and metabolic rates are determined by water temperature. Because of this, trout become most stressed when temperatures are at their extremes—very cold or very warm. The effect of warm water temperatures is often compounded by low dissolved oxygen and presence of large numbers of active predators at that time of year, but that’s a topic for a future blog.
As water temperatures cool, a trout’s metabolism slows and it becomes less active. Smaller fish are affected first, becoming fairly inactive when water temperatures fall into the 40s (Fahrenheit). Larger fish will remain more active in cooler water but eventually will become less active as water temperatures fall into the 30s. When this happens, trout need very little food, which is a good thing, since food availability declines substantially during the winter. On the other hand, slow metabolic rates mean that fish cannot move quickly to avoid predators or rapidly changing flow and habitat conditions like they can in the summer. Despite the fact that many common avian (bird) predators migrate away from cold climates in the winter (e.g., osprey), numerous bird and mammal predators remain present and active throughout the winter in the Rocky Mountains. Generally, winter flows in Rocky Mountain trout streams are very stable, with two exceptions: during periods of rapid ice formation and break-up, and in regulated rivers when abrupt flow changes are made at dams or diversion points.
To minimize their vulnerability to predation and to rapidly changing flow conditions, trout move out of preferred summer-time feeding areas and to favorable winter habitat conditions during fall, as flows fall toward their winter baseflow levels, temperatures drop, and the last major insect hatches of the autumn wane. Adult trout seek slow, deep pools that contain large cobbles and boulders. Juvenile fish seek spaces within cobble-boulder substrate and spaces formed by woody vegetation and rocks along streambanks. Trout of all ages will also seek areas of the river where groundwater inputs moderate winter water temperatures and prevent ice formation. When fish are in good condition going into the winter and suitable and stable habitat is available to them, survival rates can be quite high for the individuals that find and claim this habitat. Fish that are in poor condition or are unable to compete with the more healthy fish for the best cover in a given river reach will generally just move out of that river reach in search of better habitat elsewhere. Fish that move or find themselves in less suitable habitat will experience higher mortality rates than the others, but this mortality is a natural feature of population dynamics in wild trout populations. Fish that survive the winter in suitable winter locations will then move back into favorable habitat the following summer. In many trout streams, particularly those with abundant food supply and good spawning and rearing habitat, the amount of habitat available during the winter sets the carrying capacity for the fish population as a whole. This is what we call the “limiting factor” on the population.
Ice formation is a regular feature of seasonal cycles in habitat characteristics in most trout streams in high latitudes and high altitudes, and trout have evolved with this phenomenon. The physics of ice formation and its effect on habitat conditions are complex, but here we will just briefly discuss three kinds of ice. The first is surface ice, which is the most common type of ice seen on the Henry’s Fork and other streams in our area. Surface ice generally forms in low-velocity reaches of the river when air temperatures are cold for extended periods. Surface ice frequently forms on the Harriman Ranch and Pinehaven reaches but can extend upstream through Last Chance. Surface ice also frequently covers all or part of the stream channel on the Henry’s Fork in the Coffee Pot area, upstream from Ashton Reservoir, and in the St. Anthony area. Surface ice forms on the lower few miles of Fall River every winter. Surface ice is also common on reaches of the Madison, Gallatin, upper Snake, South Fork, and main Snake. Upon initial formation of surface ice, water continues to flow underneath the ice, and in fact, research has shown that trout actually use surface ice as cover from overhead predators. In small streams, snow that accumulates on top of surface ice can bridge the water surface, insulating the water from the atmosphere and providing stable overhead cover during the middle of the winter. In larger rivers, surface ice usually forms and melts in cycles throughout the winter as weather conditions change.
A second type of ice is anchor ice, which forms when ice suspended in the water column (frazil ice or “slush”) freezes onto the stream bottom. This type of ice often forms in higher-velocity areas, where turbulence forces frazil ice that has formed at the surface down to the bottom of the stream. Anchor ice has a greater negative effect on available trout habitat than surface ice because anchor ice fills in the spaces among cobble-boulder substrate and woody debris that are preferred by juvenile trout.
A third type of icing phenomenon is ice damming, which generally occurs in shallow riffle areas and upstream of natural and artificial constrictions in the river channel. In this phenomenon, the river’s flow is physically dammed by ice in the channel, forcing water over the top of existing ice cover, out of the channel and up onto the floodplain. Ice dams in the Henry’s Fork region frequently form to thickness of 10 feet or more and affect several miles of stream for weeks at a time, until warm weather breaks up the dam and sends large blocks of ice and associated debris downstream. During formation of these dams, large amounts of water is tied up in ice formation, causing river flow downstream to decrease until the dam reaches its maximum extent or breaks up.
Extensive ice dams form every winter on lower Fall River, sometimes filling the channel and floodplain from the Highway 20 Bridge upstream as much as 5 miles. Large ice dams also routinely form upstream from Ashton Reservoir and in the town of St. Anthony. An ice damming event upstream from Ashton Reservoir in the early 2000s physically uprooted dozens of mature cottonwood trees along North River Road (Fisherman’s Drive), washed out a portion of the road, and tore the remaining portion of the deck off of the old bridge at the Ashton Reservoir county boat dock. Another ice dam during that same time period flooded the Salem-Parker Highway and destroyed the bridge over the Henry’s Fork on that road. Obviously, trout habitat is minimal to non-existent in reaches affected by formation and break-up of these ice dams. Although localized mortality of trout is probably higher in these reaches during the period of damming, trout move in and out of these reaches according to habitat conditions and weather.
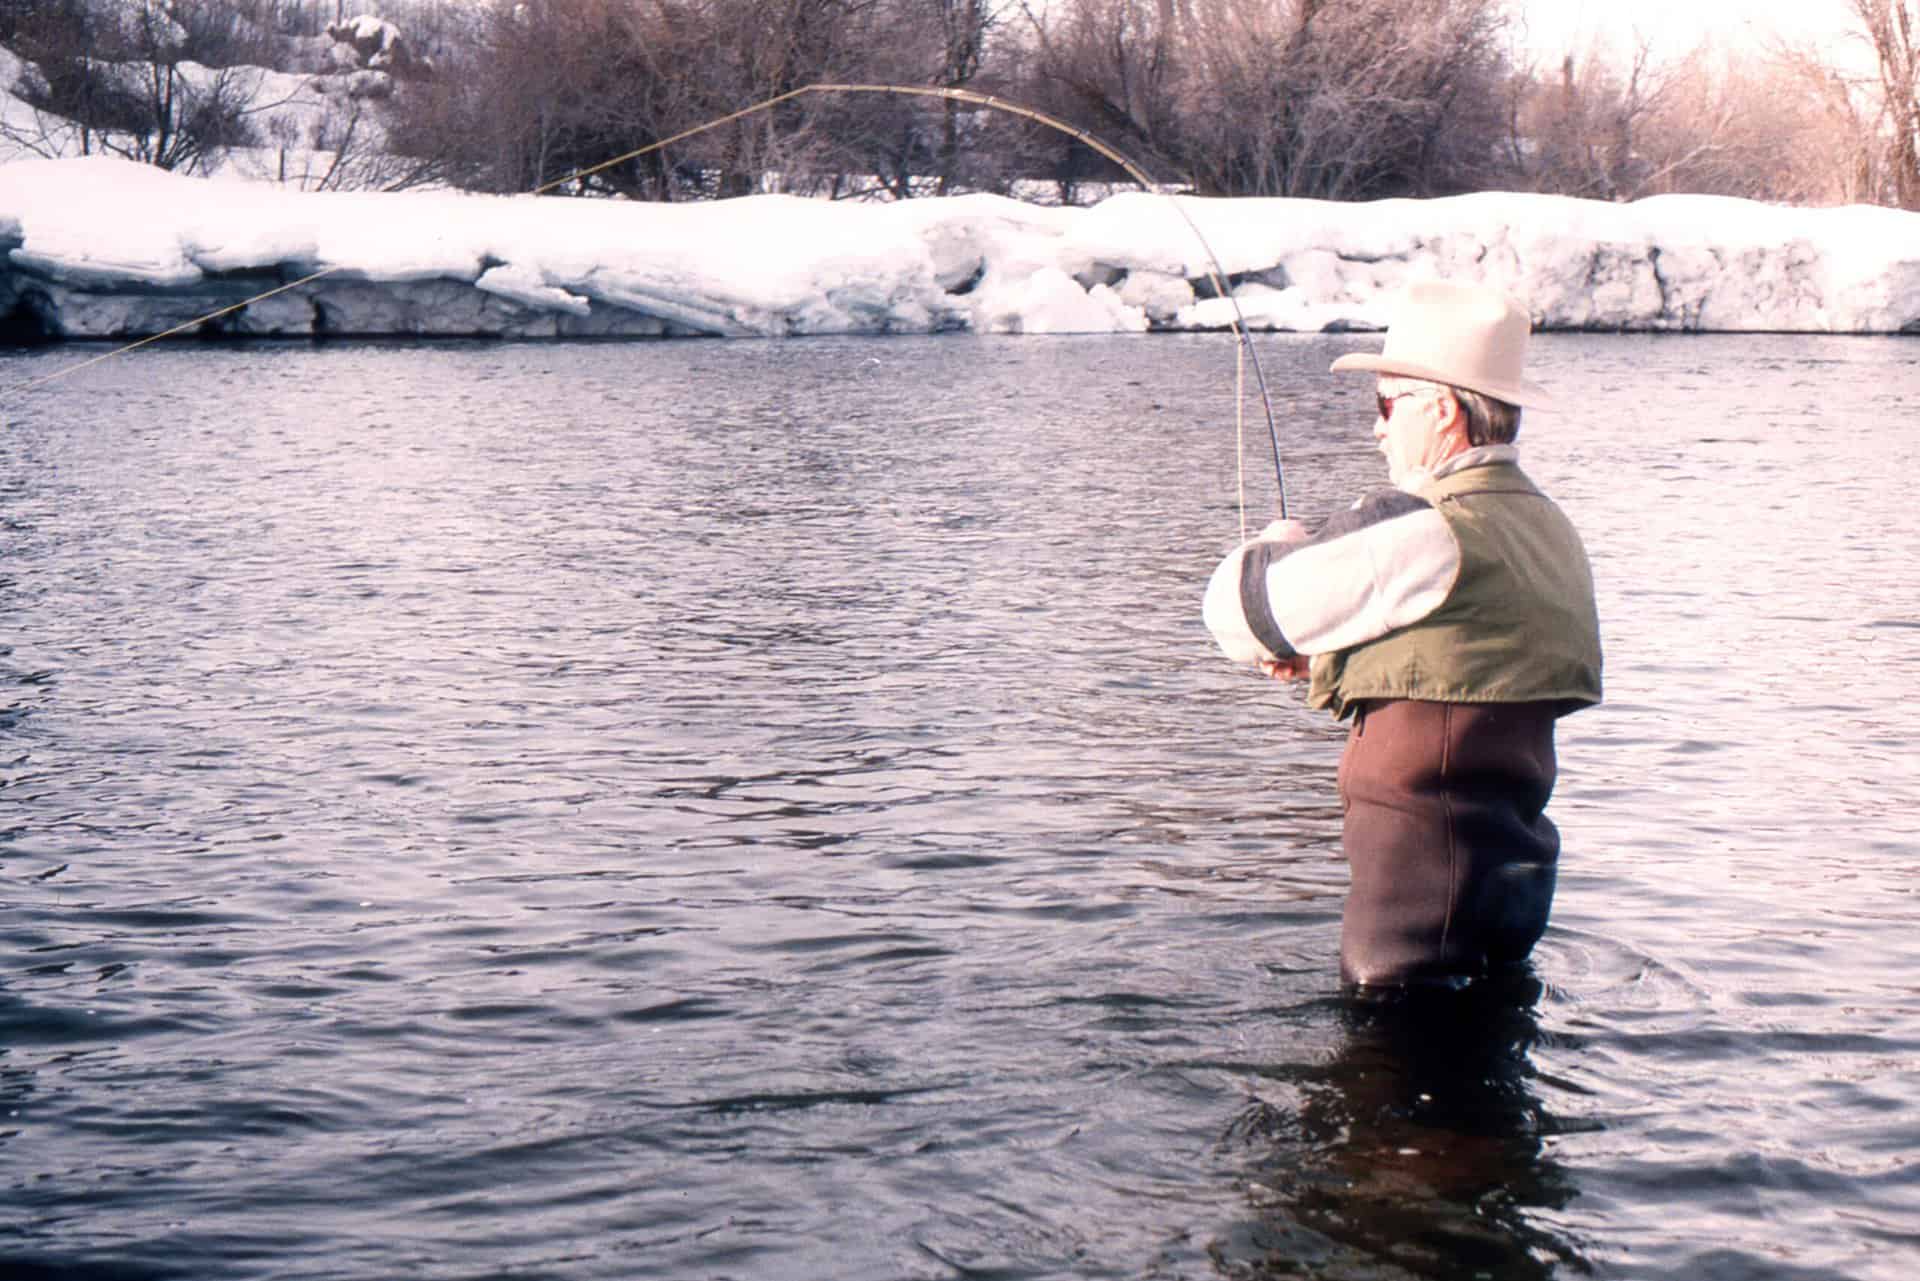
On a personal, non-scientific note, we should mention that Rob fishes as much during the winter as during the summer, frequently fishing the reaches of the Henry’s Fork and Fall River affected by ice dams. He routinely catches fish in these reaches within a few days after break-up of ice dams, often wading in the river at the bottom of ice canyons with vertical walls 6-10 feet high.
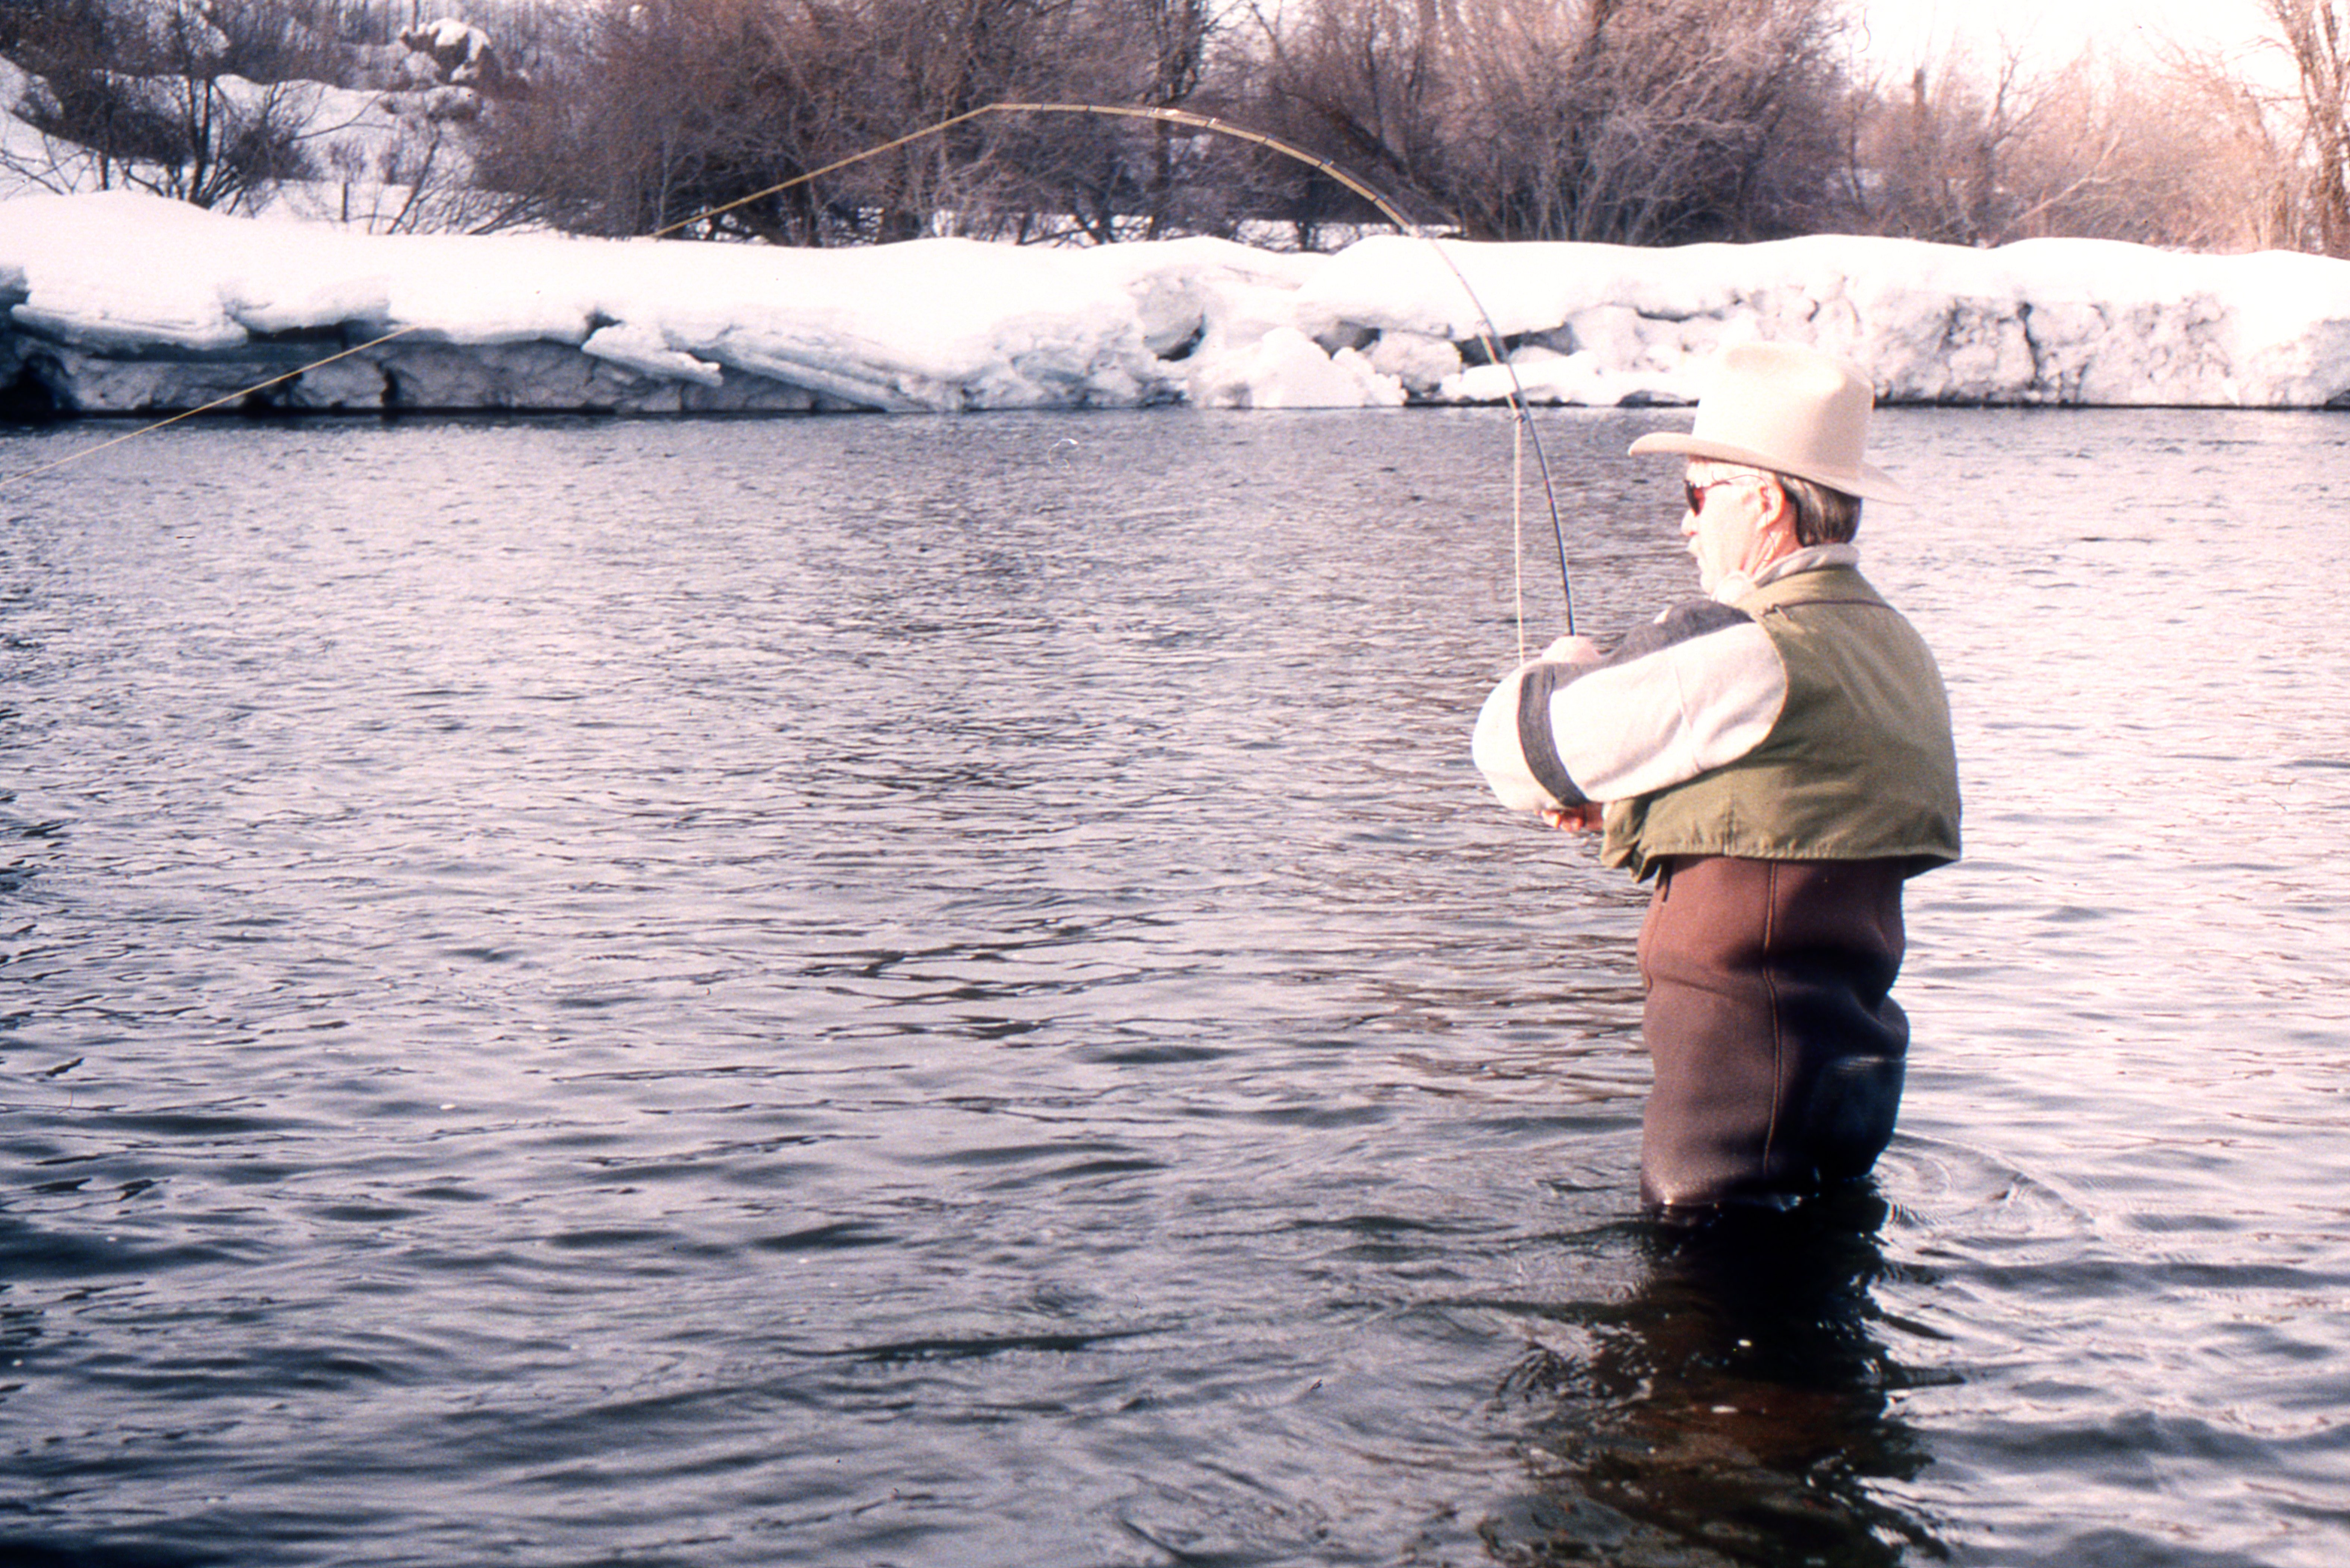
Photo caption: Winter fishing on Fall River. Note 3-5 foot thick remnants of ice dams on the bank.
Winter trout ecology in the Caldera Reach of the Henry’s Fork
The winter ecology of rainbow trout in the Henry’s Fork has been thoroughly studied; in fact, much of the broader scientific literature on winter trout ecology was generated by research here on the Henry’s Fork. Dr. Jack Griffith and his graduate students studied winter trout ecology on the Henry’s Fork in the 1980s and 1990s. Other researchers have continued to add to that substantial body of knowledge since then. Although initially focused on summer habitat use, our recent research on seasonal habitat availability in the Ranch has provided a large amount of data complementing the winter research to explain how rainbow trout in the Henry’s Fork navigate large seasonal changes in habitat available to them in the reach between Island Park Dam and Riverside Campground. We could write an entire book just on this subject; here we will just provide the main points in bullet form. If you would like to see the scientific papers, reports, or data substantiating these items, please let us know.
- Rooted aquatic plants (macrophytes) provide the vast majority of physical habitat for trout between Last Chance and Pinehaven. Regardless of flow or weather conditions, this habitat is present only from early June through early November, with some variations in quality, quantity and duration depending on sunlight and nutrient availability during a given growing season.
- Fish move into areas dominated by macrophytes in June and move out in November. Very few juvenile trout persist through the winter in the Ranch and Harriman East under any weather or flow conditions. The few adult trout that remain in this reach during the winter are concentrated in a few deep pools and in areas where springs keep water temperatures warm.
- Macrophyte cover is the single largest determinant of water depth in the Ranch. As an example, the difference between 80 cfs of discharge from Island Park Reservoir and 400 cfs (a huge difference, from a winter-flow perspective) results in a mean increase in depth of only 2.7 inches in the Ranch, whereas the difference across seasons due to changes in macrophyte abundance alone can be as much as 9 inches.
- Adult trout will persist in the transition reaches at Last Chance and Pinehaven later into the fall and return earlier in the spring than in Harriman proper, depending on local habitat conditions and insect hatches.
- Once in winter locations, trout of all ages move very little between mid-November and the onset of spawning migrations in late February.
- Mid-winter water temperatures in Box Canyon are much warmer than in other reaches of the river because of the influence of the spring-fed Buffalo River and thermal stratification in Island Park Reservoir. This latter situation occurs because water is delivered from the bottom of the reservoir, and water is most dense at 39 degrees Fahrenheit. This means that water coming out of the dam during the winter is 39 degrees, compared with 32 degrees for water coming into the reservoir.
- The population of wild rainbow trout in the Caldera reach of the Henry’s Fork is limited by winter habitat for juvenile fish.
Relationship between winter conditions and the trout population
The last bullet item above summarizes the results of dozens of scientific papers, graduate theses, and technical reports. Implicit, but maybe not obvious in that statement, is that there is no evidence from decades of research that the wild trout population in the Henry’s Fork from Island Park Dam to Riverside Campground is limited by spawning habitat quantity or quality, food availability, summer-time habitat, or survival of adult trout. This means that improving any or all of these things will not increase the trout population size, until or unless the amount of habitat for juvenile trout is increased. That is not to say that we shouldn’t maintain or even enhance these attributes; for example, maintaining or enhancing macrophyte cover in the Ranch during the summer enhances summer habitat for rainbow trout and improves the quality of the angling experience, but it does not increase the number of trout in the population. We have never found any correlation between environmental conditions and the size of the adult wild trout population.
The majority of winter habitat for juvenile trout in the Caldera reach of the Henry’s Fork is found in the Buffalo River and in Box Canyon. Construction of the modern Buffalo River fish ladder in late 2005 has greatly increased access to and use of the Buffalo River by Henry’s Fork rainbow trout. Roughly 2000 trout, mostly juveniles, migrate from the Henry’s Fork into the Buffalo River each fall to take advantage of warmer water and better winter conditions in the Buffalo River.
For juvenile fish that remain in the Box Canyon reach of the river, availability of winter habitat is directly related to the amount of water released from Island Park Dam. The bottom line from extensive field research and data analysis is that the single best predictor of the number of fish that survive to join the population of catchable-sized fish (2 years old, about 9 inches long in the spring of that year) is the mean flow at Island Park Dam from December 1 to February 28, hereafter referred to as “winter flow.” After accounting for the effects of winter flow on survival of juvenile trout, no other flow, temperature or other environmental variable helps explain any additional pattern in trout survival. The dependence of trout recruitment on winter flow is shown in the following graph.

Aside from the water-year 2004 and 2016 data points, which we will discuss below, there are two important things to notice about this graph. First, the ability of the statistical model to predict trout recruitment from winter flow (the “fit” of the model) is greatest at low flows and worst at high flows. This means that at low to average winter flows, there is little uncertainty in the relationship; more water means more fish. At higher flows, the scatter in the data points is greater, which means that there are other factors besides flow that affect trout recruitment. On average, we get more fish when there is more water, but that isn’t always the case. However, recruitment at the higher flows is always higher than it is at low flows, so the uncertainty in our model and understanding is less relevant when flows are high.
Second, notice that the relationship is not a straight line. It is curved and what mathematicians call “concave-down” or “convex.” This means that the “slope” (the derivative, for those of you who have taken calculus) of the relationship gets flatter as flows get higher. The “slope” tells us how much trout recruitment increases per unit of increase in winter flow. The fact that this slope is greatest at low flows means that the increase in recruitment per unit change in flow is greatest when flows are lowest, and hence every additional cfs we can deliver from Island Park Reservoir when water supply is scarce makes a noticeable difference in the population. To put specific numbers on this, at a winter flow of 100 cfs, each increase of 1 cfs adds 8.7 more age-2 fish in the population two years hence. A mere 10 cfs increase, from 100 to 110 cfs adds 87 more fish! At the high end, when flow is 700 cfs, a 10 cfs increase in flow would add less than a third of that, only around 33 fish. So, when it comes to producing more fish, water is more valuable when it is scarce than when it is abundant.
How is winter flow at Island Park Reservoir determined?
Because the single most important factor determining the size of the rainbow trout population is December-February flow, a large amount of HFF’s time and energy throughout the year is spent on ensuring that winter flow at Island Park Dam will be as high as possible under given external constraints. Just as a large amount of research effort has gone into winter fish ecology on the Henry’s Fork, an equally large amount of research effort has gone into understanding hydrology, water supply, and water management. Again boiling down a book’s worth of information, the key points are:
- Management of Island Park Reservoir is done in the context of the entire upper Snake River system of reservoirs and water rights.
- Because Island Park Reservoir is physically located in a headwater area but its storage water rights are junior to most of the other storage rights in the system, maximum benefit to Island Park storage-rights holders occurs when Island Park is filled as much as possible by April 1, the first day of legal irrigation season in the upper Snake River basin.
- To fill Island Park Reservoir to its capacity of 135,000 acre-feet of water, the top foot of water must be retained by a one-foot inflatable rubber dam on top of the spillway. This rubber dam was installed when the Island Park hydroelectric power plant was built to allow the plant to use water that would have otherwise spilled over the spillway.
- Island Park Reservoir is usually still covered with ice on April 1, and the rubber dam cannot be operated efficiently when the reservoir is covered with ice, so the maximum reservoir content that can be accommodated on April 1 is 127,000 acre-feet. The remaining 8,000 acre-feet must be filled after the ice melts.
- Winter outflow from Island Park is a function of reservoir contents going into the winter (“carryover” from the previous irrigation season) and winter inflow, but the more important of these two factors is reservoir carryover, and in particular, the amount of water in the reservoir on December 1, the beginning of the critical winter period.
- Lowering outflows during October and November to attain the maximum possible reservoir content on December 1 maximizes winter flow and hence trout recruitment. An exception is when very cold weather hits during November, essentially when “winter” conditions begin prior to December 1.
- Lowering flows in October and November encourages fish to move out of the Ranch and into Box Canyon, the Buffalo River, and other suitable wintering locations before water temperatures get extremely low. Data show no negative effects of these low late-fall flows on fish survival.
- The Island Park hydroelectric plant requires at least 200 cfs to operate, and the minimum amount of water that can be released from the dam gates when the plant is not operating is 80 cfs, without shutting flow all the way to 0.
Operational procedure
This set of observations leads to the following procedure, which is fully discussed and implemented by the Island Park Drought Management Planning Committee, consisting of HFF, Fremont-Madison Irrigation District, U.S. Bureau of Reclamation, and other agencies and nongovernmental organizations.
- On or around October 1, when irrigation demand decreases, lower outflow from Island Park Reservoir as much as possible, subject to the flow thresholds listed above and the need to provide a little late-season irrigation water in the St. Anthony area. This fills the reservoir at a higher rate while temperatures are still warm so that outflow can be increased on December 1.
- In early November, project winter-season inflow to Island Park Reservoir (explained in the next section). Based on projected reservoir content on December 1 and the estimated winter inflow, estimate the average winter outflow that will be necessary to attain a reservoir contents of 127,000 acre-feet on April 1.
- On or around December 1, increase outflow to the amount projected in step 2. If abnormally cold weather hits prior to December 1, outflow is increased at that point in time; if unseasonably warm weather continues into December, the increase in outflow is postponed until the weather gets cold.
- Monitor inflows, reservoir fill rates, weather, and snow accumulation throughout the winter so that adjustments can be made as needed. Given that large changes in flow during winter are disruptive to fish, mid-winter changes are usually kept to a minimum and are generally small in magnitude.
Projecting winter inflow to Island Park Reservoir
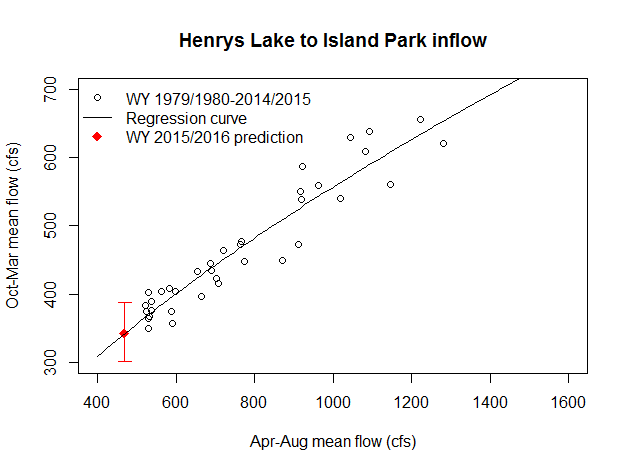
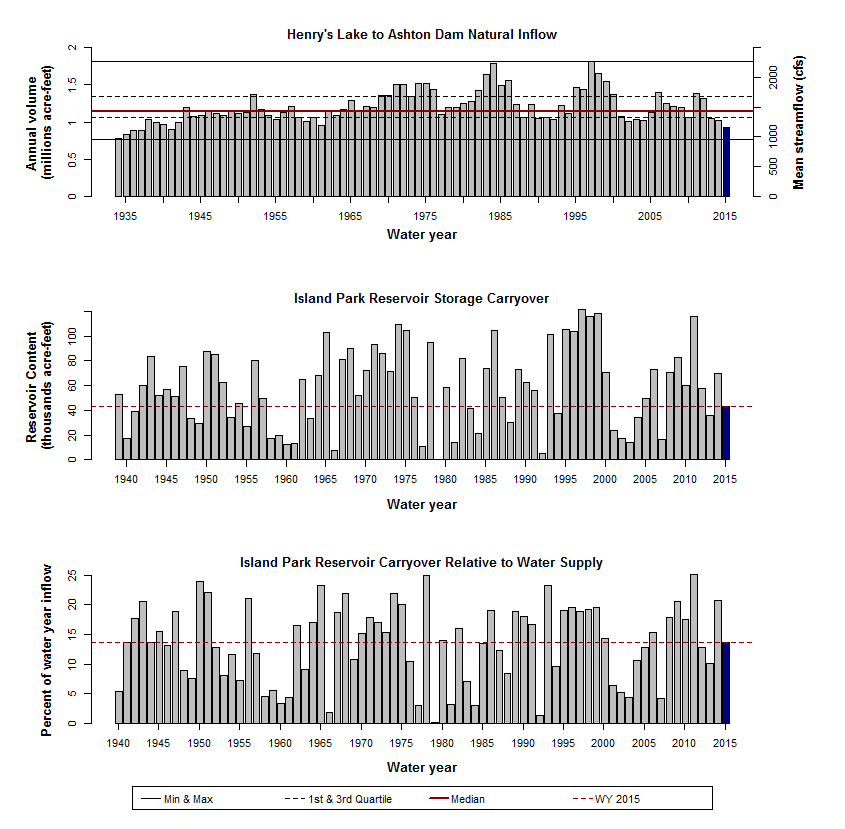
Because the upper Henry’s Fork is primarily fed by groundwater springs, winter inflow to Island Park Reservoir is extremely stable and predictable. This inflow does not count the more variable but small contribution of the Henry’s Lake basin, which is usually stored in Henry’s Lake during the winter anyway and does not contribute to Island Park fill. The following graph shows the very tight relationship between winter inflow to Island Park Reservoir and inflow over the preceding spring and summer. At the end of the summer, we can use this relationship to obtain a very precise estimate of winter inflow. We will discuss the 2016 prediction in more detail below.
A few concluding observations about Island Park Reservoir management
Any water management actions during the summer that minimize delivery of storage water from Island Park Reservoir increase winter flows and hence trout recruitment. This is why HFF is constantly working year-round and across the whole Snake River basin to minimize annual delivery of Island Park storage water.
Maximizing winter flow delivery at Island Park Reservoir is done to maximize survival of juvenile trout in Box Canyon, not to maintain habitat at Last Chance or in the Ranch. Remember that an increase in winter flow, say, from 80 cfs to 400 cfs increases mean depth in the Ranch only 2.7 inches, which, during winter in absence of macrophyte cover, would have no benefit to trout, even if trout remained in that reach during the winter. On the other hand, that same increase in winter flow more than doubles trout recruitment—from about 1500 to over 3000 age-2 fish—because of its benefit to habitat in Box Canyon.
Lastly, since 2005, when the Island Park Drought Management Planning Committee was formalized through Congressional legislation, the approach of managing Island Park Reservoir by lowering outflow in the fall in order to have more flow available during the winter, has increased average winter flows by over 10% and increased the trout population size by an average of 300 fish, compared to previous management. See Rob’s article in the fall 2013 newsletter for more details on the history of winter flow management.
Flows during fall and winter of 2015-2016
Okay, first off, 2015 was the driest water year since 1941 and by far the driest since the late 1970s, when the current water-rights accounting system was implemented by Water District 1. Despite this, reservoir carryover at the end of the 2015 irrigation season was nowhere near its minimum. In fact, the 2015 carryover of around 43,000 acre-feet (32% of capacity) was higher than carryover in 25 other water years. Looked at in proportion to water supply, about 13% of the total annual supply of water that flowed into the reservoir was still there on October 1. This is much higher than average relative carryover, and higher than that in 35 other water years. Typical carryover during other recent dry years such as 1989, 1994, and 2001-2003 was 5-10% of total supply. In other words, relative to the extreme drought we experienced in 2015, Island Park Reservoir ended up with much more storage carryover than expected, allowing higher flows this winter than we would have expected. These water-supply figures are shown in the graph below. Numerous factors led to this high carryover, including rain in May, careful management, and full storage-rights accounts across the whole upper Snake River system. More on this in a minute.
Next, our strategy of filling the reservoir as much as possible during the fall worked well, and we received a little bonus inflow from several good rainstorms and from outflow from Henry’s Lake, which supplied only a small amount of irrigation water in 2015. By the time last week’s cold spell hit, Island Park Reservoir had already filled to about 67,000 acre-feet, about half full.
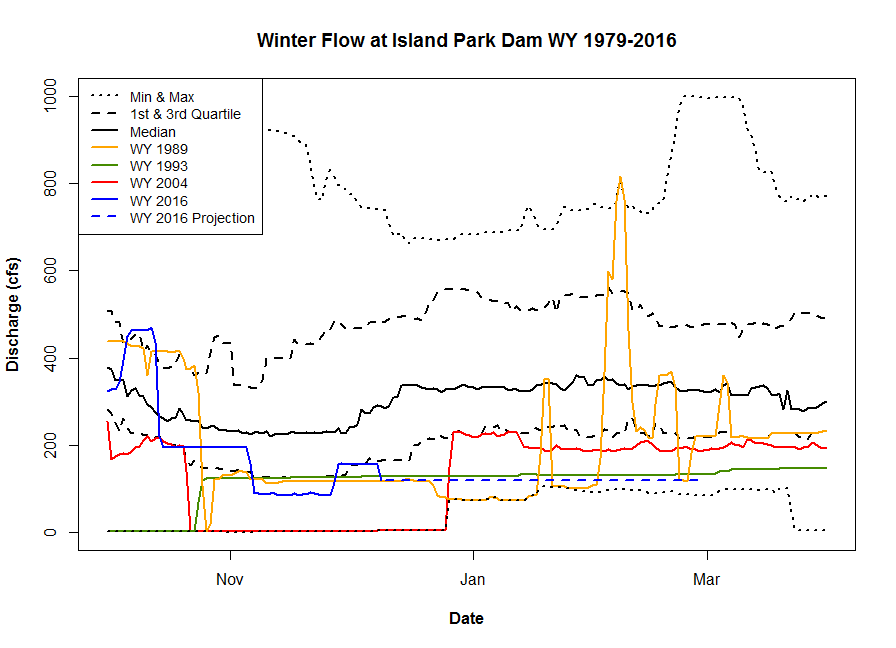
So, two out of the three terms in the reservoir fill calculation were in our favor in late November, when the first cold spell of the winter was forecast to hit eastern Idaho. Unfortunately, the third piece of the calculation was off-the-charts low. Because the spring and summer of 2015 were so dry, groundwater supply is low, and our projected winter inflow was the lowest during the modern management era, as shown in the earlier graphic. Projected inflow for the upcoming winter is a dismal 341 cfs, with margin of error of around plus or minus 50 cfs. Inflows last week were hovering only slightly above the projected 341 cfs. Thus, despite good carryover and 24,000 acre-feet of storage during the fall, the poor inflows left us with a winter flow projection of only 120 cfs. Because the cold weather hit a little earlier than December 1, flows were increased on November 27 to a little more than 120 cfs, and the current plan is to lower them to 120 cfs a few days from now.
The graph below summarizes fall and winter flows at Island Park Dam since water year 1979. It is apparent that this year’s 120 cfs is much lower than average, but very nearly the same as flow in 1993 and at least a little higher than the minimum ever recorded. Several other dry years are shown in this graph, included the infamous winter of 1989-90, when extremely cold weather stranded large numbers of trumpeter swans in the Harriman reach, resulting in a short-term flow release of 400 cfs to free swans from ice. Waterfowl management and how that plays into the fisheries equation is another story for a future blog. We included water years 1993 and 2004 in this graph because flow was decreased to zero for extended periods in the fall of both of those years, making our 85 cfs delivery in mid-November of 2015 look pretty good.
Before leaving the flow issue and concluding with some data on temperatures, we want to re-visit one exceptional water-management challenge that faced us during the summer of 2015. That was the request from Fall River Rural Electric Cooperative to deliver a large amount of water from Island Park Dam to facilitate a test of its turbines at Chester Dam. To recap, the original request was delivery of 2200 cfs for 5 days during the week of June 22. We received notice of this request on June 16. Thanks to cooperation from Fall River Electric, reasoned discussion among Island Park Drought Management Planning Committee members, and careful analysis of water supply and irrigation demand, HFF and its partners were able to move the test to the week of July 20, when irrigation demand was lower. Resulting flow out of Island Park Reservoir peaked at 2000 cfs instead of 2200. We also condensed the duration of peak-flow delivery from 5 days to less than 63 hours. These two changes saved 4,500 acre-feet of storage water in Island Park. In addition, all parties agreed that to save the maximum amount of water, the water needed for the flow test would be turned on and turned off instantaneously, rather than gradually ramping flows up and down on either end of the peak delivery. During the summer, fish can adjust to rapidly changing conditions, unlike in the winter when their metabolism is low. By choosing not to ramp flows gradually according to the usual rates used at Island Park, another 1,000 acre-feet of water was saved. Taken as a whole, our careful, scientific, collaborative approach to delivering the Chester turbine test flow saved 5,500 acre-feet of water, when compared to the original proposal. This savings turned out to be worth 31 cfs of winter flow during the upcoming winter, a 34% increase over what would have otherwise been around 90 cfs all winter. This increase in flow will produce an expected increase in trout recruitment of 269 age-2 fish in the spring of 2017, roughly an 18% increase over what would have happened under the original Chester turbine test proposal.
And what about temperature, anyway?
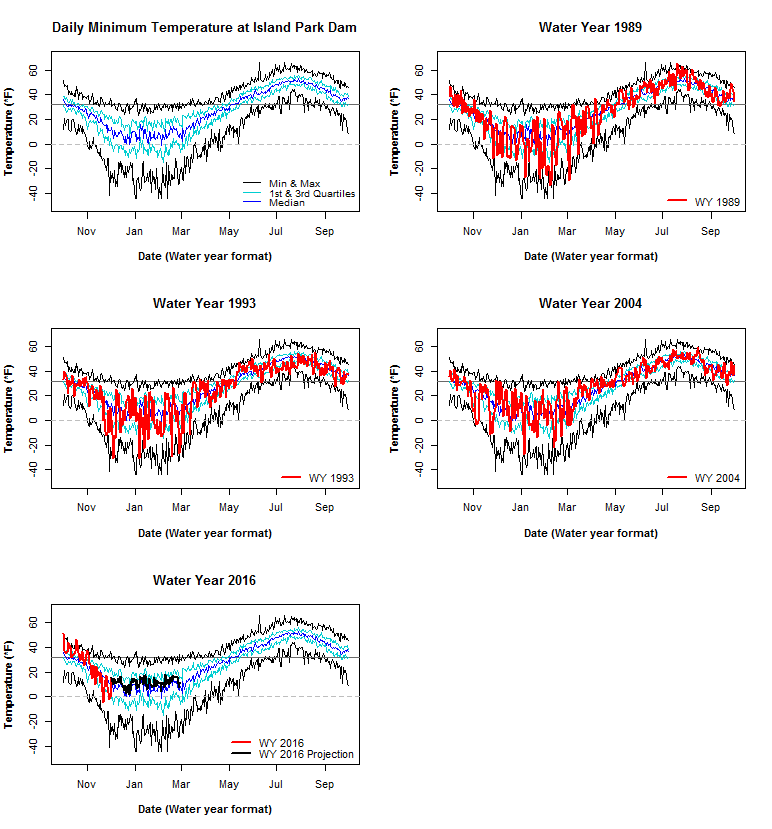
As explained above, temperature does not have a statistically significant effect on mean trout recruitment, at least not one that we can detect across the 20 or so years of data in our current model. However, we dug into the temperature data just to see how last week’s cold spell stacked up and what 2016 is likely to look like. Current long-range forecasts call for a higher probability of above-average temperatures than for either normal or below-average temperatures. Based on this forecast, we assumed that the winter of 2016 will be slightly above average, with minimum temperatures at the 60th percentile over those observed since the late 1970s. The graph below summarizes minimum temperatures at Island Park Dam since the late 1970s. On top of the statistical summaries, we’ve added observed temperatures for 1989, 1993, 2004, and 2016 (actual data through November, projections after that). These are the same years for which flow is depicted on the graph above. You can see from the graphs that minimum temperatures in the range of -20F to -40F can occur at any time between late November and early March. During last week’s cold spell, minimum temperatures in Island Park were near 0F, with only a few days in the -1F to -10F range. These were around the 25th percentile for late November—colder than average but not extreme. By contrast, temperatures fell below -20F for extended periods and multiple times during the winter in 1989 and 1993, two other years with low winter flows. The winter of 2004 was relatively mild, with above-average temperatures occurring for most of the winter. Current forecasts suggest that 2016 will be similar to 2004.
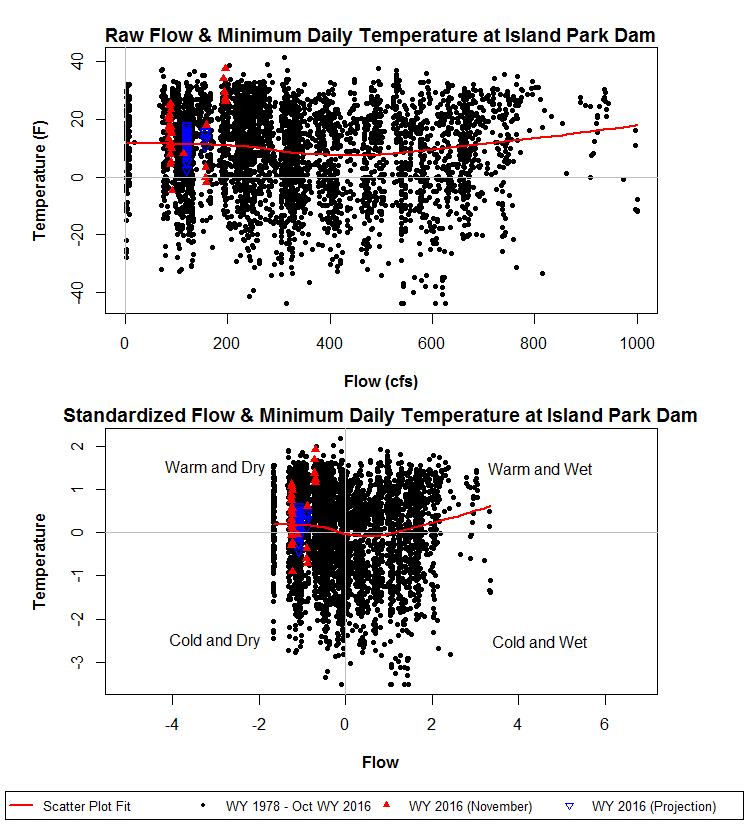
Our last graph plots daily flow on the horizontal axis and daily temperature on the vertical axis. Each point is a single day during the November-February period of every water year between 1978 and 2015 except a few years during the 1980s with incomplete temperature records. We have plotted observed data from November 2015 and our projections from 2016. The top panel shows the data in its original units—cfs for flow and degrees Fahrenheit for temperature. The red curve shows a fit to the data, which is essentially a horizontal line, indicating that winter flow and winter temperatures are independent of the other. You can see that the points for 2016 indicate much lower than average winter flows, which we have already discussed. However, you can also see that the observed November 2015 temperatures are generally on the warm side.
The bottom graph shows the same data, but in standardized measurement units. These standardized data are obtained from the raw data by subtracting out the mean and dividing by the standard deviation. This puts flow and temperature on the same scale and also conveniently divides the data into four quadrants, because the coordinate axes now represent the mean. From this plot it is clear that 2016 flows are projected to be well below average, but temperatures are projected to be slightly above average. Even during last week’s cold spell, temperatures fell below average for only a few days and even then were only 1 standard deviation below average. The graph clearly shows that there are many days since the late 1970s when flows were as low or lower than they were last week and temperatures were much colder. Last week’s cold spell should have little if any effect on the trout population.