Hello! My name is Otto Lang, and I am a postdoctoral researcher with Boise State University and the Henry’s Fork Foundation. I’m working alongside Rob Van Kirk at the HFF, Lejo Flores, Professor in Geosciences at Boise State University, and Sarah Newcomb at Trout Unlimited. Together, we are in the midst of a two-year WaterSMART project funded by the U.S. Bureau of Reclamation to improve predictions of snow water supply across the Upper Snake River watershed above Menan, Idaho. In this blog post, I’ll share the motivation behind this project, my snow observations from trips into the field in February and March, as well as some closing thoughts on the story of this season’s snowpack and my plans for the summer ahead.
Snow Water Supply
Water supply is the amount of water available in a given water year (October – September). Adequate water supply supports healthy fisheries in the Upper Snake (Like the Henry’s Fork), and is crucial for sustaining downstream agriculture on the Snake River Plain. In this region, and much of the West, the majority of our water supply comes from precipitation during the winter, and most of that precipitation is typically snow. Snow accumulates into a snowpack and melts in the spring and early summer. Some of this snowmelt goes directly into streams, and some percolates into soils and recharges groundwater. The snowmelt timeframe is usually March-June, depending on year and location, and the large pulse of meltwater leaving the snowpack leads to an abrupt increase in streamflow, which is referred to as “spring runoff”. Managing water during this time period is critical, since spring runoff is a large portion of the yearly water supply.
Manmade reservoirs, such as Island Park Reservoir and Henry’s Lake, are designed to capture water during the spring runoff peak and save it for the dry summer months, when water demand is highest. They are often managed by federal agencies, such as the Bureau of Reclamation, which controls (in part) how much water is stored vs. released from the reservoir, often balancing competing interests of irrigation demand, ecosystem health, and flood control. Water managers at these agencies rely on the Northwest River Forecast Center and local knowledge to provide predictions of streamflow before and during runoff. Although these water supply forecasts are invaluable, they are not always perfect, especially during snowmelt. A lot of this forecast uncertainty originates from the relatively short time span between when the snowpack holds the most water (which we call peak snow water equivalent or “peak SWE”) and when the snow melts out completely. This all occurs over the course of just a few months and is highly influenced by both spring weather and how the snowpack accumulated during the winter.
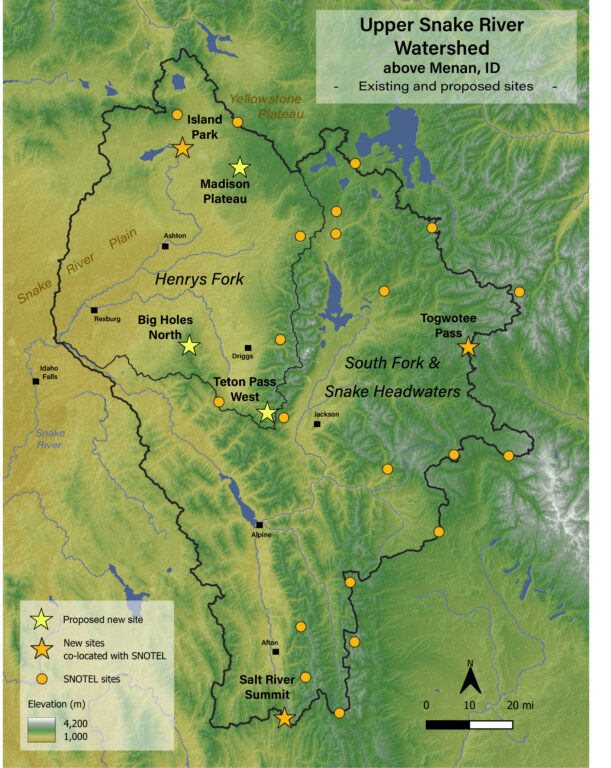
To help improve water supply forecasts, we are installing snow study stations across the Upper Snake above Menan, ID. These stations will be equipped to measure meteorological variables that control snowmelt, like solar and thermal radiation, air temperature, humidity, and wind speed. We plan to install these stations at six locations across the watershed, selected for their accessibility and relationship to existing infrastructure. Some sites were chosen because their geography is not currently represented by weather and snow monitoring, whereas other sites were specifically chosen to be built next to existing infrastructure to utilize historical records. The locations of the proposed sites are shown on the map below. We are hoping to get instrumentation installed at all six sites this summer, with the help of a Baucus Climate Scholar. Until then, there is no reason to let an entire snow season go by unmeasured!
 Water Year 2026 – A Wet Snow Drought
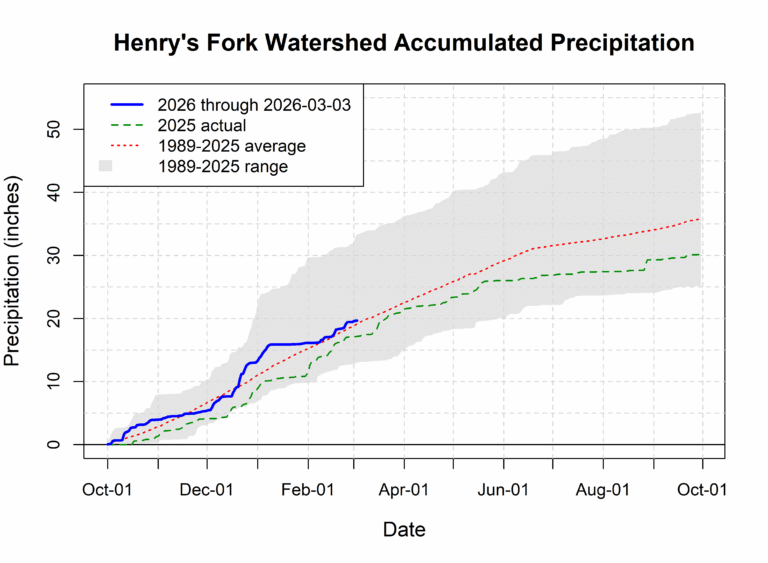
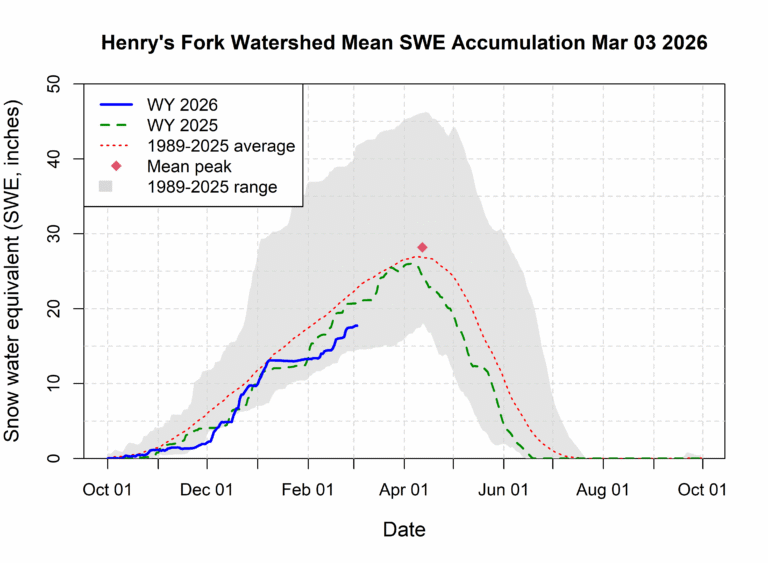
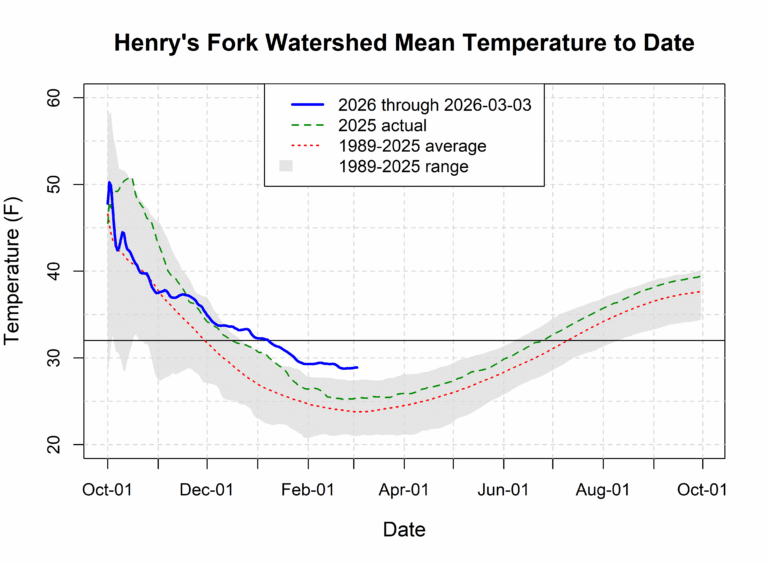
The 2026 water year has certainly been unusual, and unfortunately, not in a particularly good way. The Henry’s Fork and many regions of the Upper Snake River watershed have received near-average precipitation since the start of the water year in October (the good news!). However, warmer-than-average temperatures have resulted in more rain and less snow, especially at lower elevations. This has led to less water being stored in our snowpack, or below average SWE, across the watershed (the less good news – see the graphs below from Rob’s water report on March 3rd).
A prolonged period of below-average SWE is known as a snow drought. This winter, we have had what we call a wet snow drought, where the Henry’s Fork and Upper Snake received substantial precipitation, but a good chunk of this precipitation was rain. Not only does rain obviously not accumulate like snow, but rain can aid in melting existing snow. Why does this matter? One of the main reasons is that snow is important for storing water later in the year (we call this snow water storage). The snowpack functions as a natural storage reservoir, holding water until the spring when it begins to melt. During years like the current one, when there is below-average SWE, we are losing water storage within the natural system that would have helped carry water into the warmer months when it is needed more by agriculture. These conditions force us to rely even more on manmade reservoirs, adding stress for water managers.
February Field Excursion
To capture more information about the state of the snowpack this year, I have been going out to the proposed station locations to measure snowpack variables (like SWE) and to get a good first look at each location under winter conditions. I visited sites in January, February, and March. Read on for my February field report and March update!
Togwotee Pass (February 21, 2026)
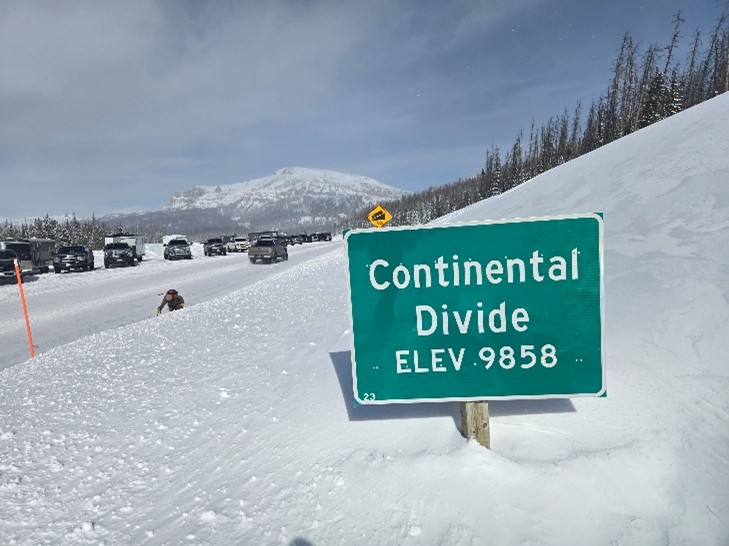 I started my February field excursion at Togwotee Pass. Here, our proposed monitoring station will be placed next to an existing SNOw TELemetry (SNOTEL) site. SNOTEL sites record variables like snow water equivalent (SWE), snow depth, and temperature, going back to the early 1980s at many locations. Our proposed station will be installed with the help of financial support from Trout Unlimited and will measure variables like radiation (both solar and thermal) as well as snowpack temperature, which are not measured by SNOTEL, and provide valuable insight into snowmelt. The Togwotee Pass SNOTEL is practically right on the Continental Divide, representing the easternmost extent of the Snake River basin. It is also our highest elevation site at 9900 ft.
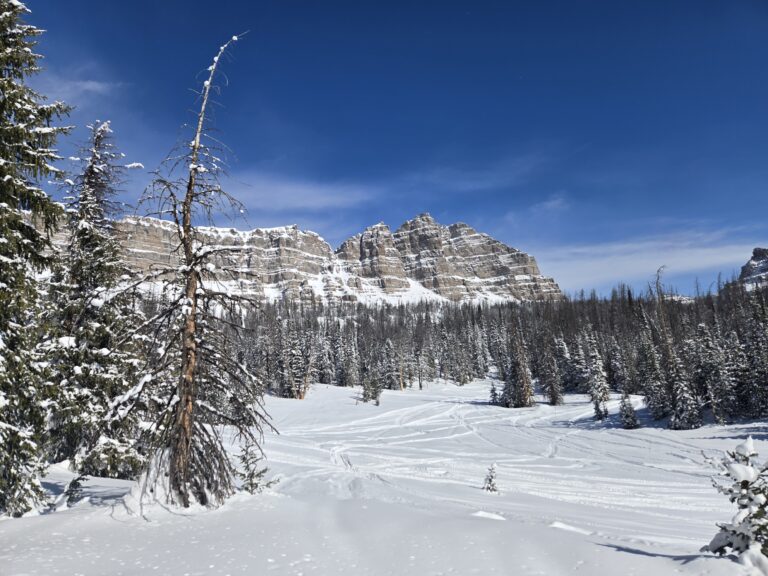
The existing SNOTEL is adjacent to a large meadow under Mt. Sublette, one of the more scenic SNOTEL locations I’ve seen.
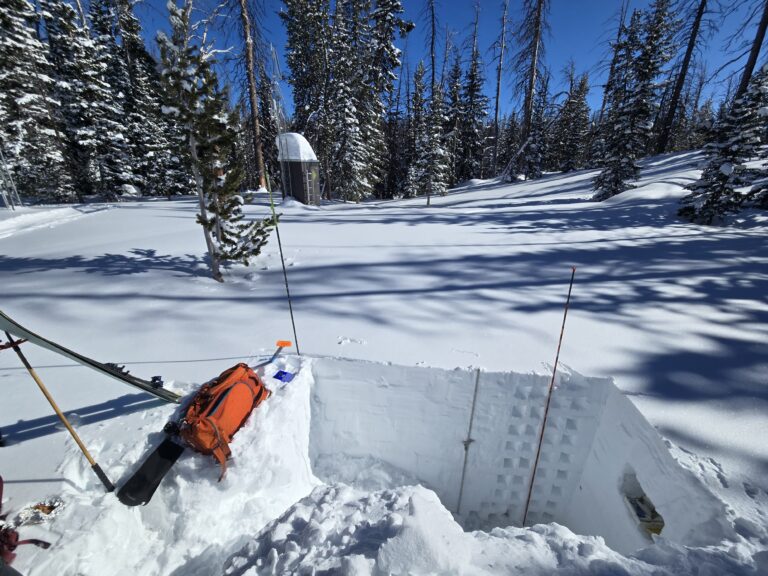
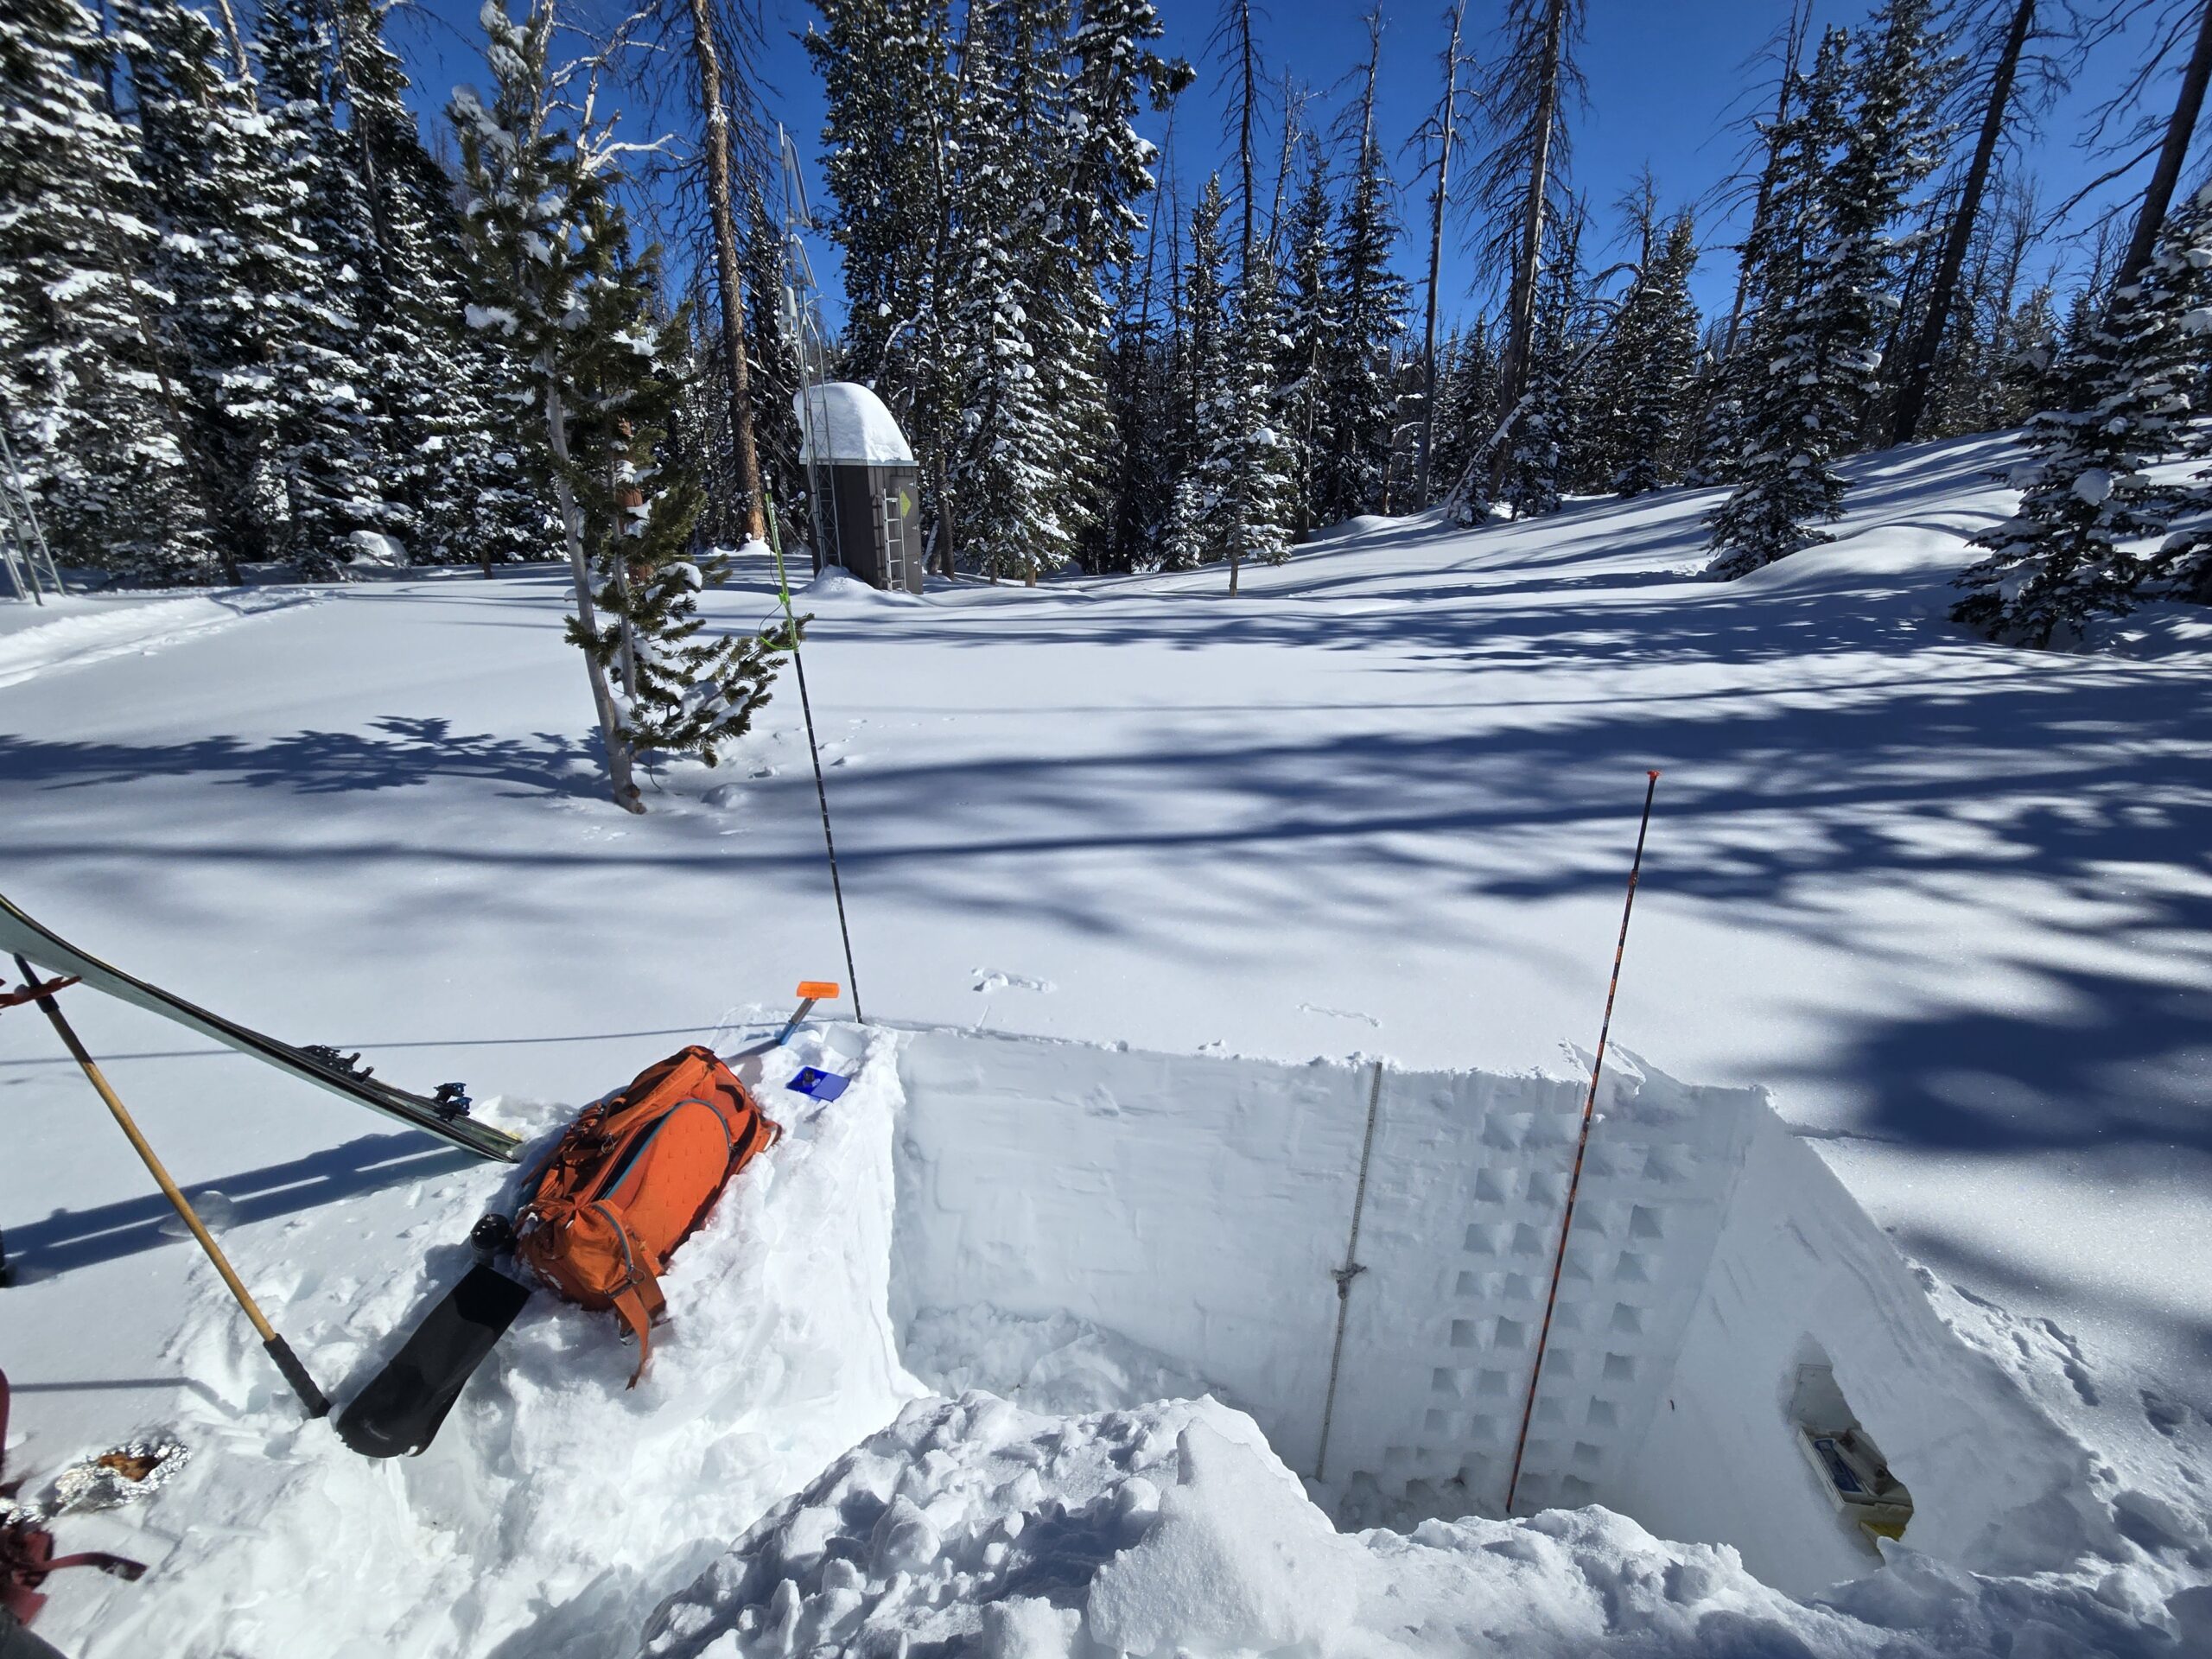
To measure SWE with high precision, I dug a full-depth snowpit and then used a device known as a density cutter to isolate a “slice” of snow every 10 cm, which I weighed with a scale. The cutter preserves the density of snow, and using the weight of the snow in the cutter, I can easily calculate the amount of SWE in the snowpack. At this site, for example, the average density of snow from the cutter was 318 kg/m3, and the snow was 180 cm (6 ft) deep. This equates to 57cm (22.5 in) of SWE. Based on the SNOTEL record, SWE at this location was above average for the time of year. This makes sense given the high elevation and overall colder temperatures of Togwotee Pass, where the vast majority of precipitation during this water year has fallen as snow. In fact, if we reference the accumulated precipitation recorded at the SNOTEL for the date, 22.6 in, the data suggests that virtually all precipitation since October has fallen as snow!
In addition to SWE, I also measured snowpack temperature down every 10 cm with a simple handheld thermometer. Why do I do this? Well, try to think of the snowpack as a cold can of soda during a hot day on the river. Now think of the winter weather as your cooler. When your cooler is nice and cold, your can of soda stays cold longer, allowing you to enjoy it for your entire float. When you forget ice in your cooler, you may end up with a warm soda halfway down the river. In other words, colder winters = colder snowpacks, which take longer to “warm up” to 0 °C (32°F) before they can start melting, thereby storing water for longer. In snow hydrology terminology, we refer to below-freezing snowpacks as having “cold content” which is a good thing if you are concerned about water in the West, as it implies more snow water storage. At Togwotee, the average snowpack temperature at this date was well below freezing, -3.5°C (26 °F), reflecting cold winter temperatures at this elevation.
Salt River Summit (February 22, 2026)
 The next stop was the Salt River Summit station located just off Salt River Pass, south of Afton, WY. Our station here will be adjacent to a SNOTEL site and is at an elevation of 7630 ft. A wildfire ran all the way up to the site in Summer 2025, but luckily, the SNOTEL was spared. I dug a snow pit for reference just adjacent to the site and recorded about 90 cm (3 ft) of snow and 9 inches of SWE, consistent with the SNOTEL, which was reading 8.8 inches at the time. Both measurements were just below average for the time of year. Accumulated precipitation (measured by the SNOTEL) was above average at 13.2 in, suggesting that only 68% of precipitation since October was snow, reflecting warmer temperatures experienced at lower elevations this winter. There was still cold content in the snowpack (-3.5°C / 26 °F), indicating we were not yet losing SWE on this date.
One thing that stood out to me here was the visible layers of char and debris from the burned trees present in the snowpack. This is important because when the snow melts and these layers are exposed, the darkened snow surface will absorb more solar radiation and will likely melt earlier. The solar radiation sensors that we plan to install at the site will hopefully capture some of this effect in the coming years.
Teton Pass (February 22, 2026)
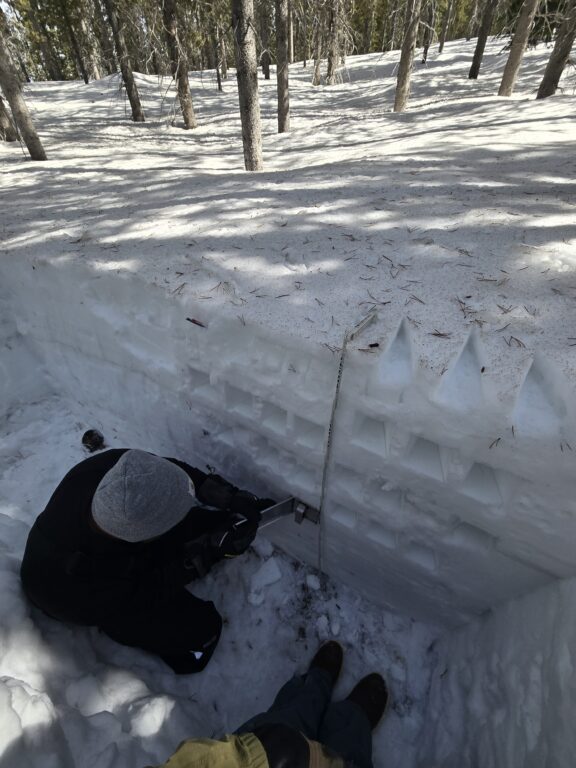
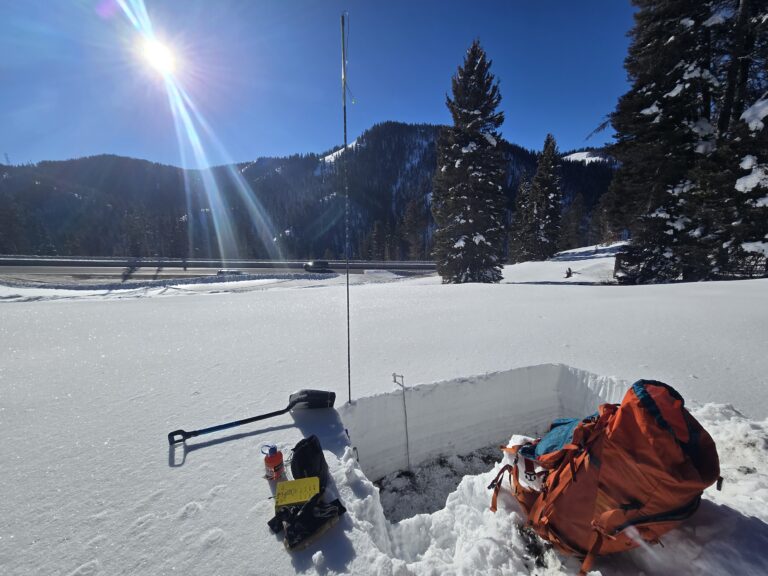 Later in the afternoon, I drove to the western side of the Teton Pass at an elevation of about 8000 ft. WYDOT maintains a snow study site at this location for avalanche mitigation purposes. The location is unique in that it generally faces south and therefore represents slopes that accumulate less snow, particularly in seasons with extended periods of sunny weather.
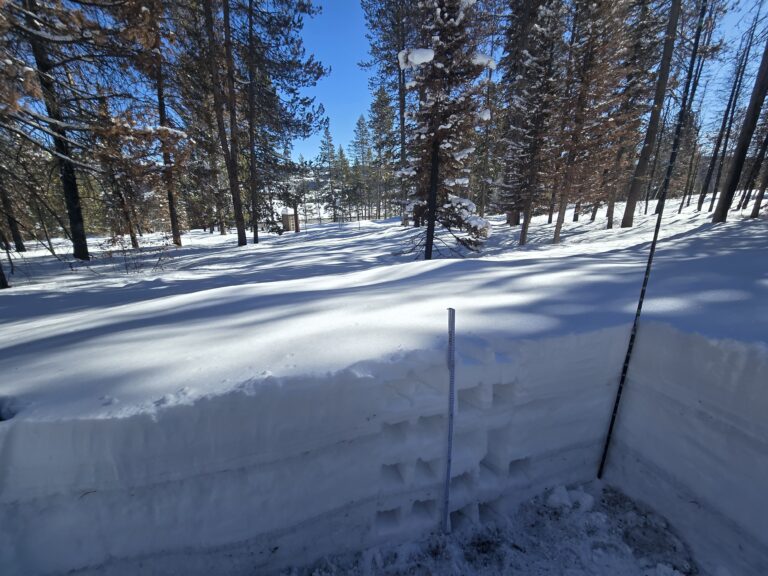
Unfortunately, I completely forgot to take a photo of the site this time, but the photo below shows the snow pit I dug in January, which had a somewhat similar snow depth (70cm or 2.3 ft). In February, I measured 80 cm of snow (2.6 ft) with 10 inches of water. Substantially less compared to the 17.5 inches of SWE recorded at the SNOTEL site on the other side of Teton Pass at the same elevation. Much of this discrepancy is likely due to the southern exposure, causing the snow to absorb more solar radiation and melt early. This was supported by the lack of cold content in the snowpack (all of it was 0°C), suggesting that we had already been losing some SWE by this date in February.
Big Holes (February 23, 2026)
In order to get to the more remote station locations, I met up with Daniel Wilcox, HFF’s Farms and Fish Program Manager, in Ashton on Monday, Feb. 23rd. Our goal was to get to the proposed station location on the northern end of the Big Hole Mountains, which requires about 10 miles of travel via snowmobile. I had never snowmobiled before, but Daniel is very experienced and was willing to take me up to the site and assist with fieldwork (and to get my snowmobile unstuck).
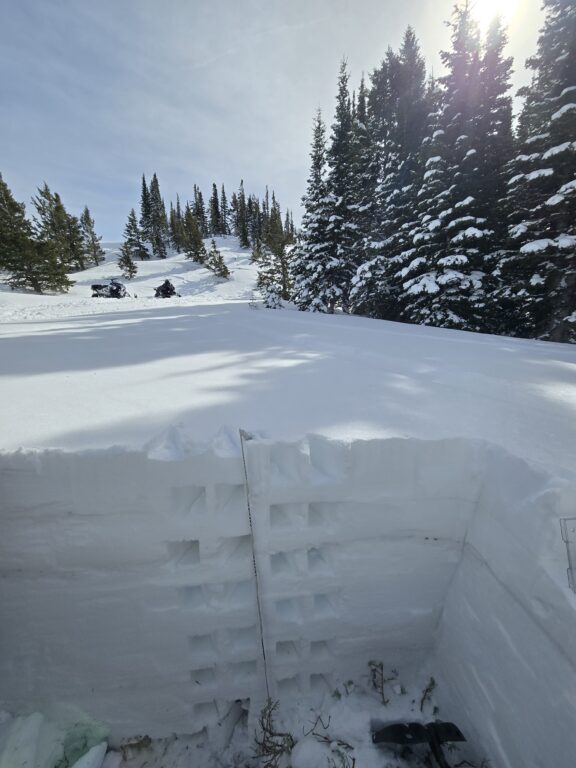
We set off in the morning. Snow at the lower elevation of the Big Holes was sparse, but as we gained elevation on Relay Ridge Road, snow depth increased substantially. Our proposed site is in a sheltered location on the easterly side of the Relay Ridge, directly below an existing cell tower at about 8400 ft. This location has no existing weather or snow monitoring stations, so our field measurements of SWE are the first and only reference we have to how much water is present at this elevation in the Big Holes. We dug a pit and measured a snow depth of 140 cm (4.5 ft), 17 inches of SWE (close to a site at a similar elevation in the Tetons), and substantial cold content (snowpack temperature of -2.5°C / 28 °F).
Madison Plateau (February 24, 2026)
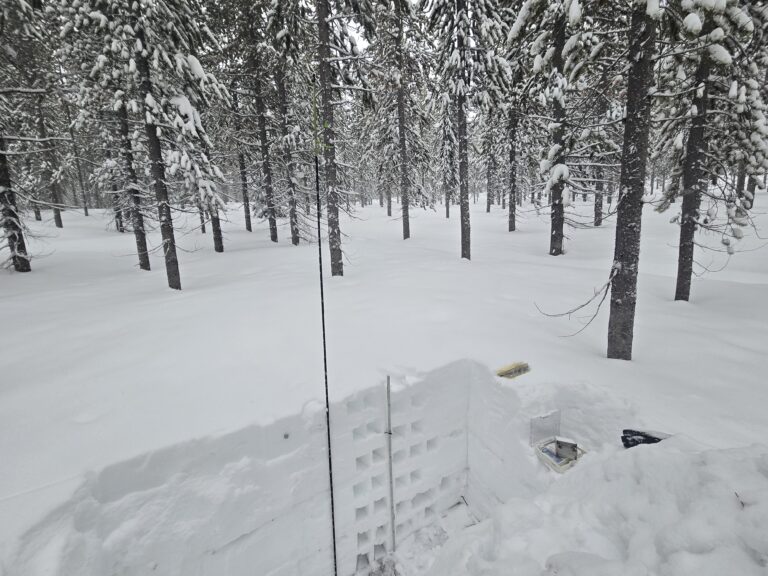 The next day, Daniel and I made our way up to Island Park to snowmobile from the Chick Creek Road up to where it intersects the Fish Creek Road on the Madison Plateau. The proposed station location here is just a few miles from the intersection within recently thinned lodgepole pine forest stands. Similar to the Big Hole site, there is no existing weather or snow infrastructure at this elevation in the region, so the measurements provide valuable new insights into the state of the SWE across the Henry’s Fork.
It was snowing quite heavily on this day, which made for more enjoyable travel with the sleds, but a bit more challenging for taking field notes. Overall, the snowpack clocked in at a depth of 140 cms (4.5 ft) and 13.8 inches of SWE, right on par with the average SWE at SNOTEL sites in the Henry’s Fork for the same day (14 in), suggesting the site may be representative of monitored snow accumulation, and is present at an elevation currently unrepresented by the network of nearby stations.
Island Park Dam (February 25, 2026)
To wrap up the February tour of snow study station locations, I spent one more snowy and rainy morning at our proposed site in a meadow adjacent to the Island Park Dam, where the Island Park SNOTEL is located. This is our lowest site at 6300 ft. The snowpit had 8.4 inches SWE, similar to the 8 inches reported by the SNOTEL next door, and well below average for the time of year. In fact, it is close to the record low of 7.7 inches recorded on Feb. 25th in 1987. Unlike other spots I visited, accumulated precipitation was actually slightly below average on the date (12.8 in). Together with SWE, this suggests only 65% of precipitation fell as snow since October. The snowpack also had no cold content and was melting as of Feb. 25th. Together, these observations reflect the meager winter we have experienced at lower elevations over the watershed.
March Update
I visited four of these sites again a few weeks later. My SWE updates are below (highest elevation at top):
- Teton Pass, March 16: 14.8 in of SWE (up 30% from Feb 22)
- Madison Plateau, March 18: 15.2 in of SWE (up 9% from Feb 23)
- Salt River Summit, March 18: 10.1 in of SWE (up 4% from Feb 22)
- Island Park, March 15: 7.4 in of SWE (down 12% from Feb 25)
Although some sites gained SWE from snowfall at the start of March, all station locations had average snowpack temperatures at or just below 0 °C. Thus, we are now losing SWE across the watershed and below average. My observations are supported by data from the SNOTEL sites, and I also noticed a dust layer exposed on the snow surface at many locations (deposited during windy conditions on March 14). The darkened snow will absorb more radiation and lead to enhanced melting as long as it is exposed on the snow surface. These conditions, coupled with long sunny days and the ongoing above-average temperatures, will (and have) melt(ed) our snowpack quickly.
Concluding Thoughts
I am pleased with the location of the sites we selected, and I think they span a good subset of elevations and land cover characteristics, while also maintaining accessibility. Given my recent excursions, the story of the snowpack this year is also very clear: Elevation is key.
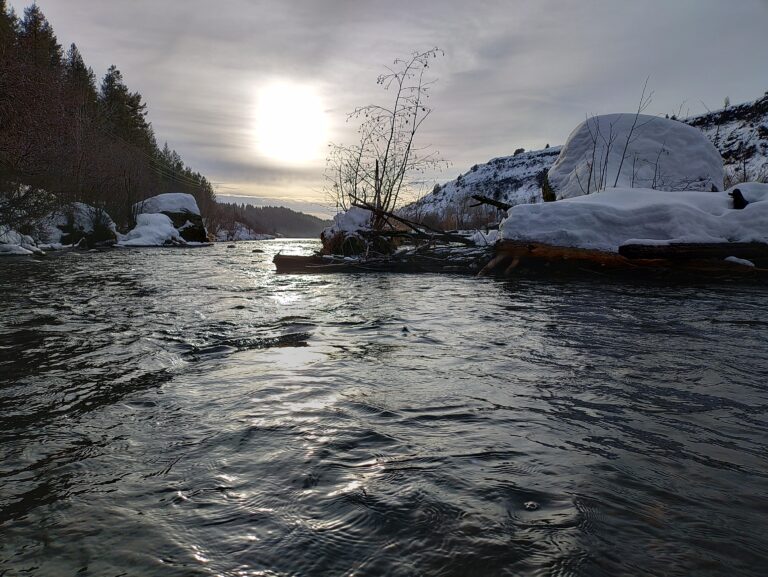
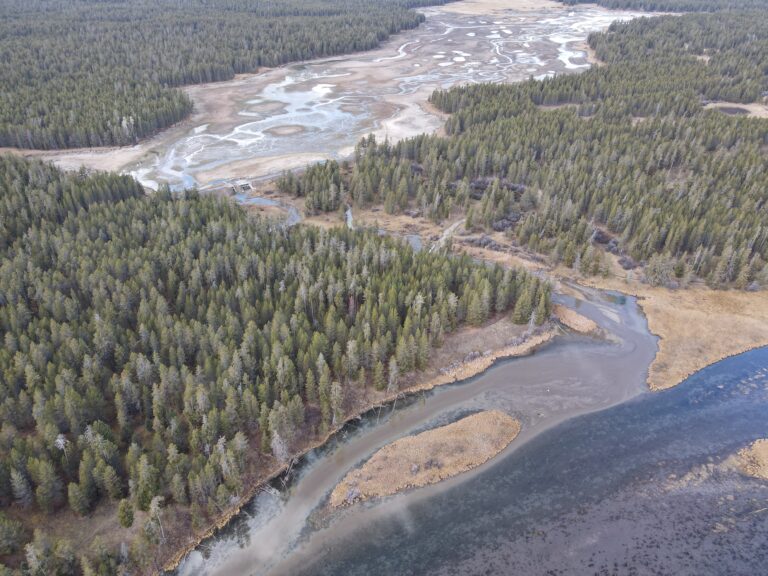
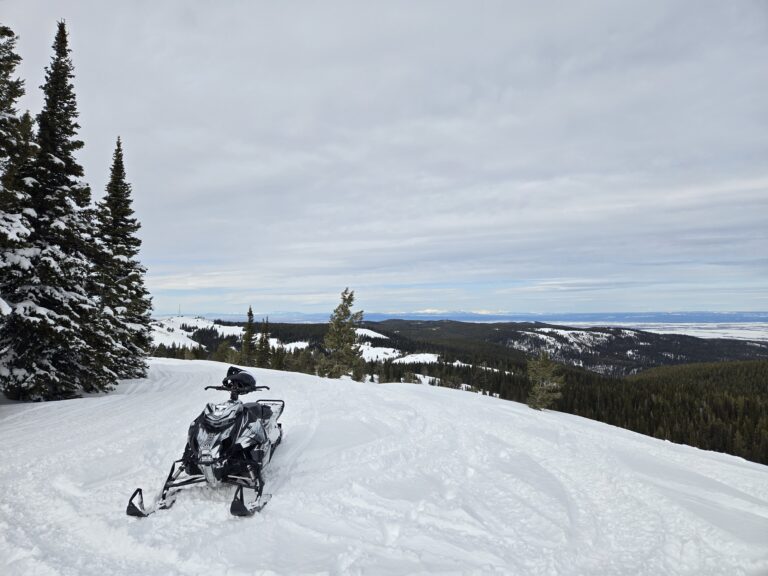
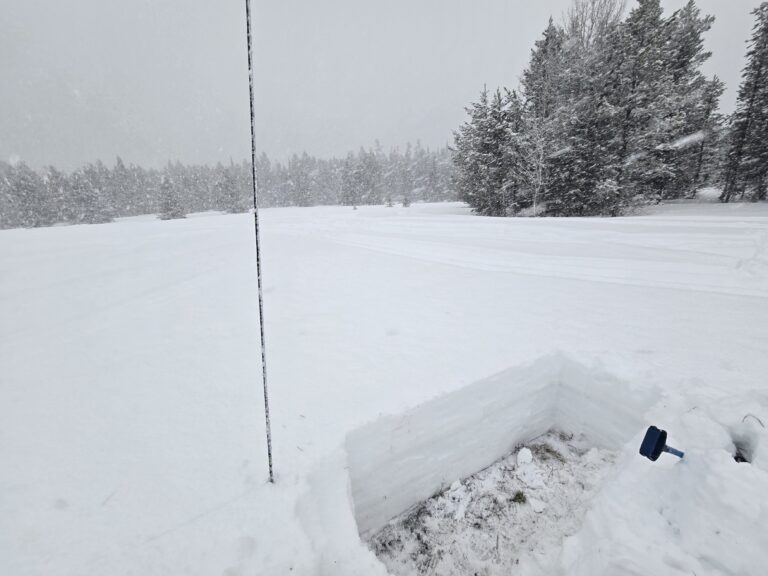
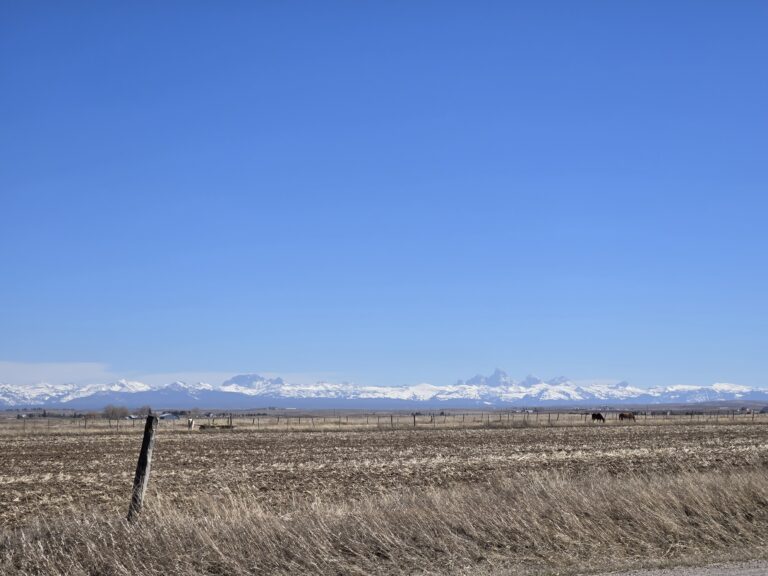
Higher elevation snowpacks are doing well, with some locations even experiencing near-average SWE. Lower elevations, such as much of the area around Island Park, are experiencing well below-average SWE, due to a wet snow drought which has brought warmer than average temperatures, near-average precipitation, more rain, and less snow accumulation. One thing that really stood out to me was the almost complete lack of mid-winter snow in the valleys and across the Snake River Plain, which you can clearly see in my photo below, and is not typical. The lack of low-elevation snow will bring potential challenges to water management since many regions of the Upper Snake have experienced even worse SWE accumulation.
We will continue to monitor the snowpack through the remainder of the melt season, and I am planning to get out in the field again soon to see how our snow-water situation has developed. I appreciate all the help and support I have received from folks at the HFF, and look forward to installing instrumentation over the summer!