In this blog post, we 1) present our turbidity and suspended sediment data, 2) explain our suspended load calculations, and 3) provide some additional information justifying why we think that a substantial amount of bed load was transported into the Henry’s Fork in addition to the suspended load.
Since first observing high turbidity in Thurmon Creek and the Henry’s Fork downstream associated with the Silver Lake drawdown in November 2025, HFF’s Science and Technology team has collected turbidity and suspended sediment samples, reviewed the drawdown timeline, and compiled hydrologic data to provide an estimate of the amount of sediment introduced into the Henry’s Fork from this event.
By way of background, streams transport two types of sediment: 1) fine material suspended in the water column, and 2) coarse material that moves along the stream bed during high flows. Our measurements of turbidity and suspended sediment concentrations from Thurmon Creek, along with 12 years of background data collected by our water quality monitoring network, allow us to calculate suspended load from this event. Unfortunately, because we did not observe the peak flow event that occurred during drawdown of the lake, we do not have data to calculate bed load.
Timeline
We have not been provided with a full and precise timeline of events, but we have assembled the following information to help constrain our sediment estimates and interpret our turbidity values.
November 7: Harriman State Park posted on social media that Silver Lake level would be lowered.
November 9-11: Post-event compilation of social media posts revealed that Harriman State Park visitors had observed that Silver Lake was being drawn down and was nearly empty around the November 9-11 timeframe.
November 19: HFF staff collecting data on the Henry’s Fork as part of our routine monitoring activities noticed that Silver Lake had been drained, there was evidence of recent high flows in the Thurmon Creek floodplain between Silver Lake Dam and the Henry’s Fork, and that turbidity in Thurmon Creek and Third Channel was visibly higher than elsewhere in the Henry’s Fork between Last Chance and Osborne Bridge. We collected a turbidity sample at that time from Thurmon Creek at the river trail footbridge, located ~760 feet downstream of the road over the top of Silver Lake dam.
November 20: HFF staff collected additional turbidity samples and one suspended sediment sample and collected aerial images of Silver Lake, Thurmon Creek, and the Henry’s Fork from a drone.
November 21-December 3: HFF collected additional turbidity samples (details below).
November 25 or 26: The Silver Lake Outlet culvert was capped, and the lake level began to increase.
Turbidity samples
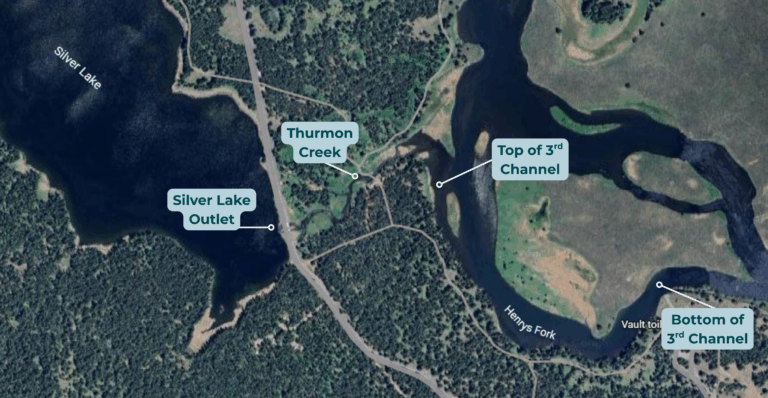
Between November 19 and December 3 we collected 18 additional turbidity samples from four locations: Silver Lake Outlet, Thurmon Creek at the footbridge, the top of what is known as “Third Channel” of the Henry’s Fork, and the bottom of Third Channel at the observation deck near the Sage Flats parking lot. These locations are shown on the map below.
Map of turbidity sampling locations
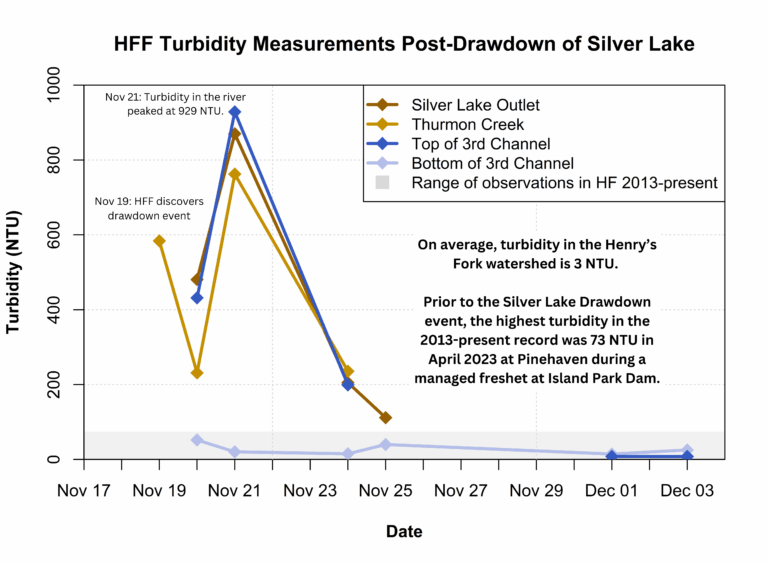
All of our turbidity samples are shown on the graph below. Turbidity samples taken from Silver Lake Outlet, Thurmon Creek, and the top of Third Channel ranged from 112 Nephelometric Turbidity Units (NTU) to 930 NTU prior to the capping of the outlet culvert. Turbidity at these locations dropped down to 8 NTU or lower after the culvert was capped and the lake started refilling. Turbidity at the bottom of Third Channel was much more consistent and in the range of 14.4-50.2 NTU from November 20 to December 3, even after the culvert was capped.
To put these turbidity values in perspective, HFF has been collecting turbidity data throughout the watershed since August 2013. Aside from the continuous turbidity data collected by our sonde network, we have collected and analyzed a total of 1,244 field samples from the Henry’s Fork and its tributaries for turbidity, using the same equipment and methods as we used to collect the recent samples associated with the Silver Lake event. Those samples were collected at all seasons of year across 13 different locations, but 45% of the samples were collected at Island Park Dam and Pinehaven, the two locations in the watershed with consistently high turbidity. We should note that this data set does not include samples from Island Park Reservoir or the South Fork Snake River, both of which we routinely monitor.
The 1,244 field turbidity samples have a range of 0.25 NTU to 73.1 NTU, with an average of 3.0 NTU. Thus, even with the bias toward high values from Island Park Dam and Pinehaven, this average of 3.0 NTU represents the background level of turbidity we would expect to find at any given location in the watershed at any given time of year. The highest value in this set, 73.1 NTU, was collected at Pinehaven on April 25, 2023 during a managed freshet delivery from Island Park Dam that was specifically designed to mobilize sediment from the river bottom, flushing it out of the Island Park to Pinehaven reach.
In the graph below, the gray shaded region depicts the full range of those 1,244 field turbidity samples, clearly illustrating two key points: 1) The turbidities we observed at Silver Lake, Thurmon Creek, and the top of Third Channel prior to capping of the lake outlet culvert were around 100 times our background level of 3 NTU and about 10 times higher even than the highest observation we made during the 2023 freshet. 2) All of the turbidity measurements we made at the bottom of Third Channel fell within the range of our historic observations across the watershed.
Turbidity time series graph for each of the four sampling locations
Suspended sediment samples
We collected two suspended sediment samples, both at the Thurmon Creek footbridge. These were collected on November 20 and November 21. These two samples were also analyzed for turbidity, which is the standard procedure we use to relate turbidity to suspended sediment. Turbidity is relatively easy and inexpensive to measure continuously via our sondes, while suspended sediment is much more time-consuming and costly to measure. We send suspended sediment samples to a commercial laboratory in Pocatello for analysis, and the current cost of a single sample is $35. So, in current dollars, the 1,244 paired turbidity-suspended sediment samples have cost us $43,540 in lab costs alone, not counting staff time, equipment, travel, and courier costs.
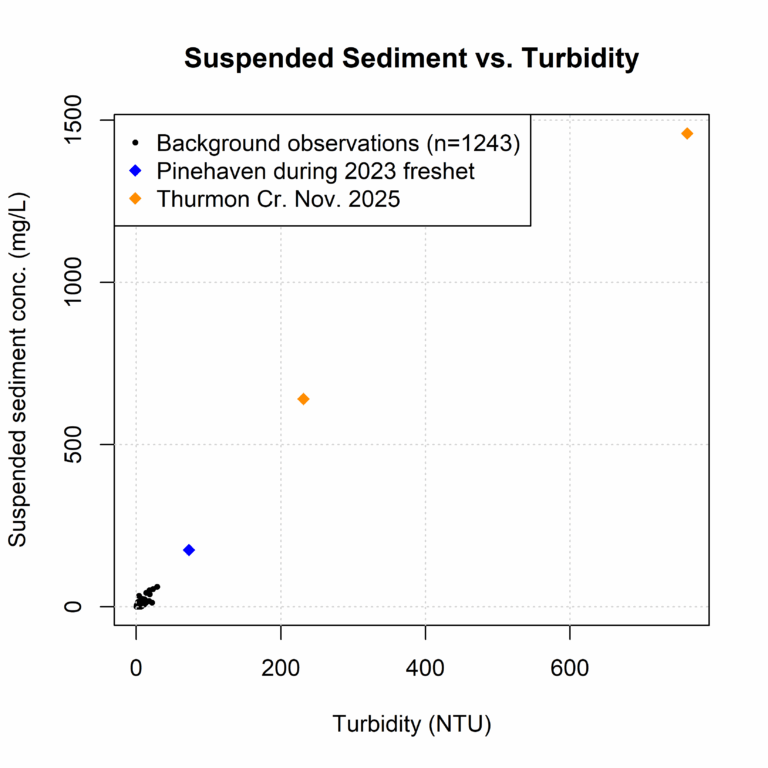
The relationship between suspended sediment concentration and turbidity is shown in the figure below. Our 1,244 field samples have a range of suspended sediment concentrations of 1.0 mg/L to 175.0 mg/L, with a mean of 4.3 mg/L. By far, the highest value in this data set is the 175 mg/L observed at Pinehaven during the April 2023 freshet. The two Thurmon Creek observations have suspended sediment concentrations of 641 and 1459 mg/L. So, the sediment concentrations we measured in Thurmon Creek are several hundred times higher than the average concentrations we have observed since 2013, even with the bias toward high values measured at Island Park Dam and Pinehaven. Further, the turbidities paired with these two sediment concentrations, 231 NTU and 762 NTU, are about at the 25th and 75th percentiles of all of the observations we made at Silver Lake Outlet, Thurmon Creek, and the head of Third Channel prior to capping of the lake outlet culvert. In other words, these two sediment concentrations represent the lower and upper ends of the range of expected values during this event.
One other observation that is apparent from this graph of suspended sediment vs. turbidity is that the two very high concentrations we observed in Thurmon Creek are consistent with the watershed-wide relationship between these two water-quality indicators that we have been observing watershed-wide for 12 years. This consistency provides evidence that the turbidity and sediment values we have recently observed in association with the Silver Lake event, while much higher in magnitude than our background observations, are not outliers in their representation of the fundamental physics of suspended sediment in the river.
Suspended sediment load calculations
We made two assumptions about hydrology in calculating the suspended sediment load that was delivered from Silver Lake to the Henry’s Fork.
We assume that little sediment was mobilized and transported during the first half of the draining of Silver Lake and that substantial transport occurred only when the bottom half was drained.
After the full draining, base streamflow in the creek occurred for two more weeks (November 11 to November 25) before the outlet culvert was capped and turbidity dropped to background levels.
Suspended load is calculated by multiplying sediment concentration (mass of sediment per volume of water) by the volume of water.
First addressing the sediment export during the lake drawdown, Silver Lake holds around 600 acre-feet of water, as can be verified in two ways. First, the water right for the lake is for 618 ac-ft when it is full. Alternatively, if you measure the surface area of the lake in Google Earth or another GIS application and multiply by a mean depth of 3.5 feet, the result is around 600 acre-feet. Half of this is 300 acre-feet, which is equivalent to 370,085,760 liters.
At our lower-quartile sediment concentration of 640 mg/L, delivery of the bottom 300 ac-ft of the volume of the lake would export 236,854,886 grams = 522,265 pounds = 261 tons of sediment. At our upper-quartile concentration of 1459 mg/L, the load is 539,955,124 grams = 1,190,601 pounds = 595 tons.
Next, we address sediment load during the two-week base flow period after the lake was drained but before the outflow culvert was capped. HFF did not measure streamflow during this period, but a very conservative (low) estimate of streamflow after the lake was drained is 2 cubic feet per second (cfs). This estimate is based on two pieces of data. First, HFF gaged Thurmon Creek at the footbridge from November 2011 to November 2012. The average daily flow we measured during the months of November 2011 and 2012 was 8 cfs. But, those were very wet years, and baseflow in the upper Henry’s Fork subwatershed this fall is about 65% of what it was in the fall of 2012. That would put baseflow in Thurmon Creek this fall at around 5 cfs. In addition, Harriman State Park staff reported that they were diverting some water from Thurmon Creek at Golden Lake to limit the amount flowing into Silver Lake, so an estimate of 2 cfs in Thurmon Creek below Silver Lake is reasonable. We obtained an independent estimate of streamflow in Thurmon Creek using the USGS StreamStats application, which is designed specifically for estimating streamflow to support water resources planning and engineering. That application puts the 80% exceedance flow (20th percentile, about where we are now for natural flow across the upper Henry’s Fork subwatershed) for the month of November at 1.78 cfs. Thus, 2 cfs is scientifically justified by two independent methods.
2 cfs = 4 acre-feet/day = 56 acre-feet over the two-week period = 69,082,675 liters. At our lower-quartile sediment concentration of 640 mg/L, 56 ac-ft would transport 44,212,912 grams = 97,489 pounds = 49 tons of sediment. At our upper-quartile concentration of 1459 mg/L, the load is 100,791,623 grams = 222,246 pounds = 111 tons.
Adding the load during the lake drawdown and the load during two weeks of base flow after the drawdown gives an estimate of 310 to 706 tons of suspended sediment introduced into the Henry’s Fork.
Bed load considerations
As mentioned above, we did not observe the creek during the period the lake was being rapidly drafted, but we do know that bed load is transported in streams during peak flow events, when stream power is high enough to mobilize bed sediments, which are heavier and harder to move the suspended sediment. Based on our timeline reconstruction, the majority of the lake was drained over a four-day period. At the full volume of 600 acre-feet, the average discharge over the four days was 150 acre-feet/day, which is equivalent to 75 cfs. Again using the StreamStats application, 75 cfs as at the lower end of the estimated median peak-flow event in Thurmon Creek under natural conditions (no regulation by upstream dams and diversions). Such a flow would be expected to occur during spring snowmelt in a typical year. This flow is also within the range of estimated bankfull discharge, which is the flow that exceeds the capacity of the channel and causes water to spill out onto the floodplain. Flows exceeding bankfull discharge are well documented in the scientific literature to be sufficiently high to mobilize stream bed load.
On November 19, we observed that grass and other vegetation along Thurmon Creek downstream of Silver Lake had been recently bent over by flow of the creek, indicating that streamflow had exceeded bankfull and was likely in the range of typical “natural” peak flow events. Between this observation and the StreamStats estimate, it is very likely that at some time during the lake drawdown, streamflow was high enough to scour, mobilize and transport bedload in the creek and deliver it to the head of Third Channel. Further, this peak flow would have mobilized Thurmon Creek delta deposits at its confluence with the Henry’s Fork.
Our conclusion is that it is very likely that bed load transport contributed additional sediment to the Henry’s Fork beyond the suspended load calculated above. However, because we did not observe the peak flow event, any estimates we make would be based on assumptions from scientific literature instead of actual observations.
Context for and fate of sediment introduced into the Henry’s Fork
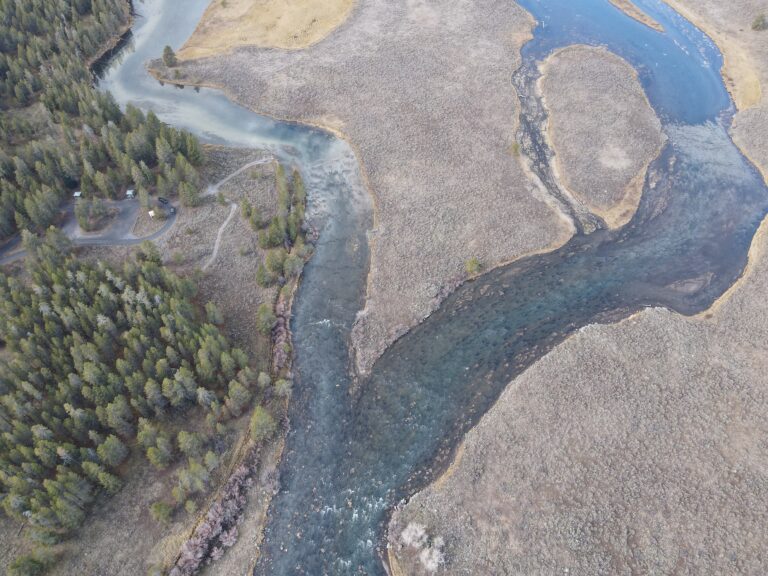
First and foremost, the turbidity data show that turbidity at the bottom of Third Channel never rose outside of our range of background values and stayed well below the values in Thurmon Creek and at the head of Third Channel. Our aerial images from November 20 confirm that visible turbidity had essentially disappeared upstream of the confluence of Third Channel with the main channel of the Henry’s Fork. Thus, it appears that the vast majority of sediment delivered to Third Channel was deposited there and remains there.
Aerial image of the confluence of Third Channel with the main channel of the Henry’s Fork (taken November 20, 2025)
Our calculations are likely conservative, but within reason. Evidence for this conclusion is based on observed sediment deposition within Third Channel. Based on drone imagery, most deposition occurred on the river right bank within third channel. We estimated deposition predominantly occurred in a 20,000 meter square area in the lower half of Thurmon creek, the Thurmon creek/Henry’s Fork confluence delta, and the river right half of third channel to the confluence with the rest of the Henry’s Fork. We walked the entire length of Third Channel on December 3, wading out into the channel where it was free of ice. We observed an average of about 3-4 inches of fine sediment covering aquatic vegetation, rocks and coarse bottom sediments throughout the channel upstream of the Sage Flats observation deck. In particular, we did not observe feet of sediment, nor did we observe a fine dusting, We used typical lakebed sediment wet bulk densities between 1.31 – 2.19 t/m³ to convert sediment tonnage to volume. Wet bulk densities are likely closer to 1.31 t/m3, since freshly-deposited lake sediments can have even lower bulk densities. We can divide the result by the depositional area to achieve an estimation of sediment depth.
Low estimation:
310 tons / 2.19 tons/m3 = 142 m3
142 m3 / 20,000 m2 = 0.0071 m or ¼ inch
High estimation:
706 tons / 1.31 tons/m3 = 539 m3
539 m3 / 20,000 m2 = 0.0270 m or ¾ inch.
While there is significant uncertainty in the bulk density of the sediment from Silver Lake, the calculations here suggest we should have seen less deposition than we did. This suggests our estimates of sediment movement out of Silver Lake are reasonable, but could be very conservative.
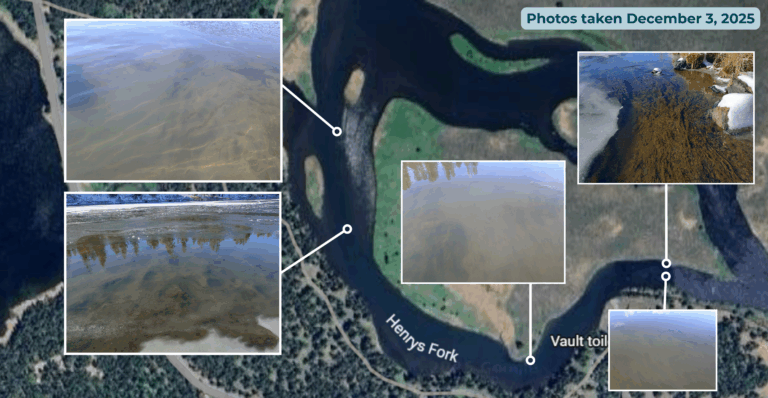
Photos taken of the river bottom on December 3, 2025 relative to their location within Third Channel
For reference, the total sediment load from the Buffalo River and all tributaries from there to Pinehaven is 510 to 733 tons per year, with an average of 591 tons over irrigation years 2016-2025. So, the Silver Lake event put roughly the same amount of sediment in the river (concentrated in Third Channel) in a few weeks as the Buffalo River, Thurmon Creek, and all other tributaries combined put into the entire river reach between the Buffalo River and Pinehaven in 6-12 months.
In early April, when ice melted off Island Park Reservoir one month earlier than usual, scientists at the Henry’s Fork Foundation (HFF) predicted an early onset of poor water quality conditions in Island Park Reservoir and the Henry’s Fork downstream. Warm air temperatures, low streamflow into the reservoir, and longer days with more sunlight are a recipe for algae blooms, the primary culprit of turbid water in Island Park. But we arrived at the end
This article was originally published in Island Park News on May 29, 2026 Ice melted on Island Park Reservoir on March 31, 2026—four weeks earlier than normal and the earliest the Henry’s Fork Foundation (HFF) has observed in 12 years of monitoring. Such an early ice melt was not unexpected given the region’s near-record warm and dry winter. But ice melting a month early has implications for water quality in Island Park Reservoir and the
Warmer and drier conditions have slowly degraded water quality in Island Park Reservoir over the last 50 years. In the 1970s and 1980s, federal reports and university research indicate that the reservoir had relatively good water quality. Island Park Reservoir was mesotrophic—with mostly clear water and occasionally low dissolved oxygen at the reservoir’s deepest depths during the summertime. But, as time went on, water quality began to decline. Historical satellite imagery analyzed by the U.S.
Photo of an ice-free Island Park Reservoir taken on March 31, 2026 On March 31, 2026, with no accompanying commentary, HFF scientist Christina Morrisett stood on top of Island Park Dam and texted colleagues Rob Van Kirk and Jack McLaren photos of open water on Island Park Reservoir. Rob, eager to see that the reservoir reality matched what he was seeing in the real-time river data downstream, texted back, “Yep! That’s close enough to ice