Water Supply and Water Quality Predictions for Summer 2026
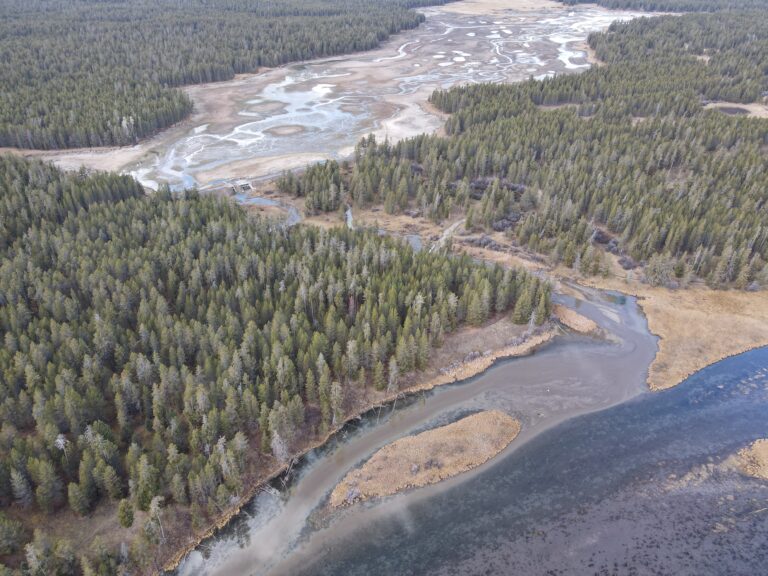
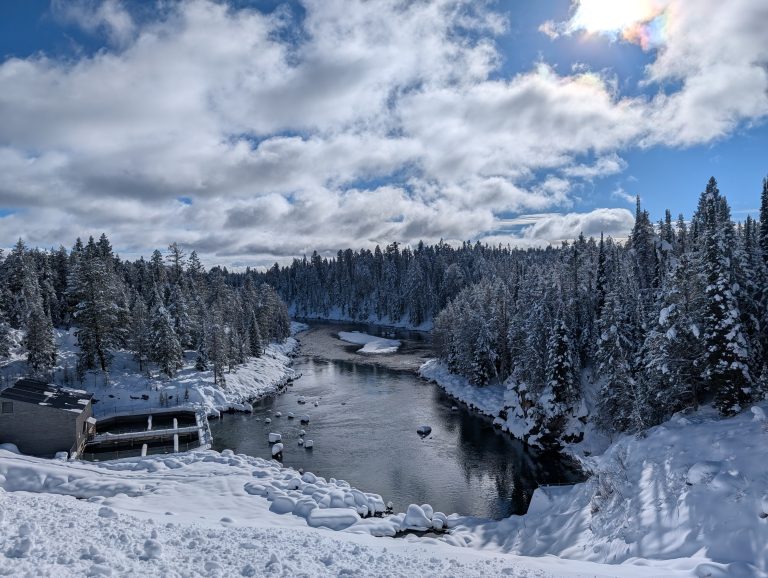
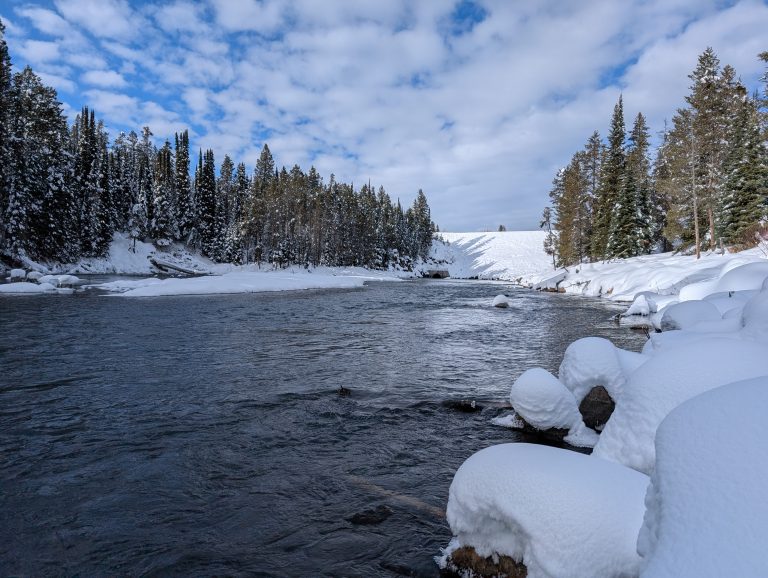
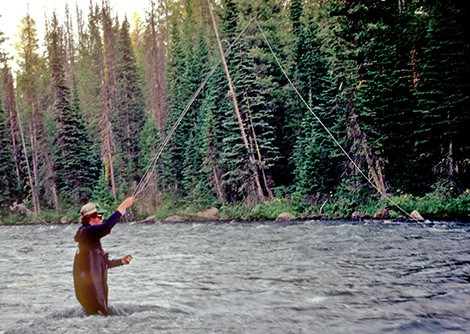
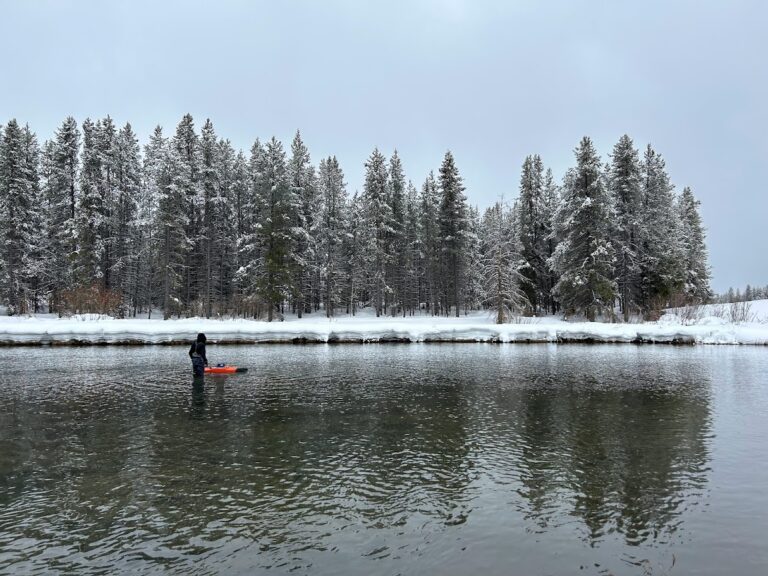
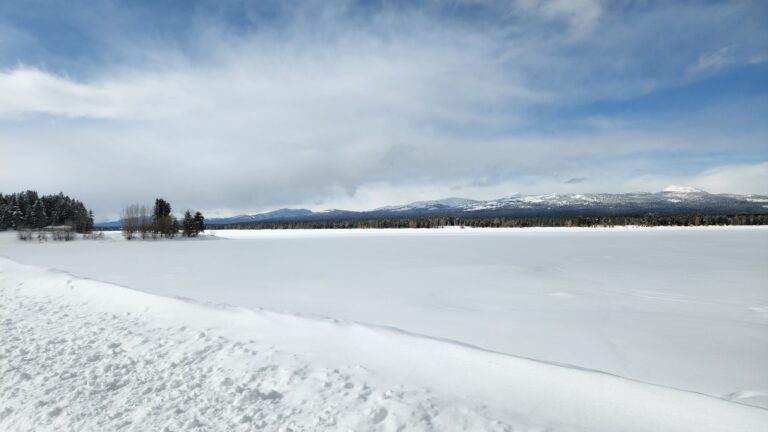
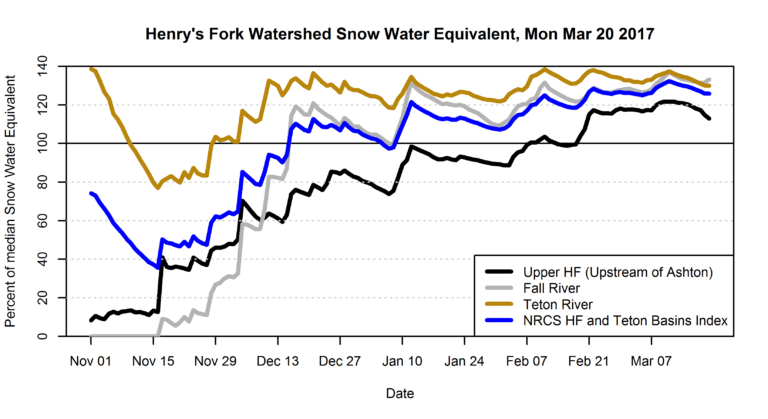
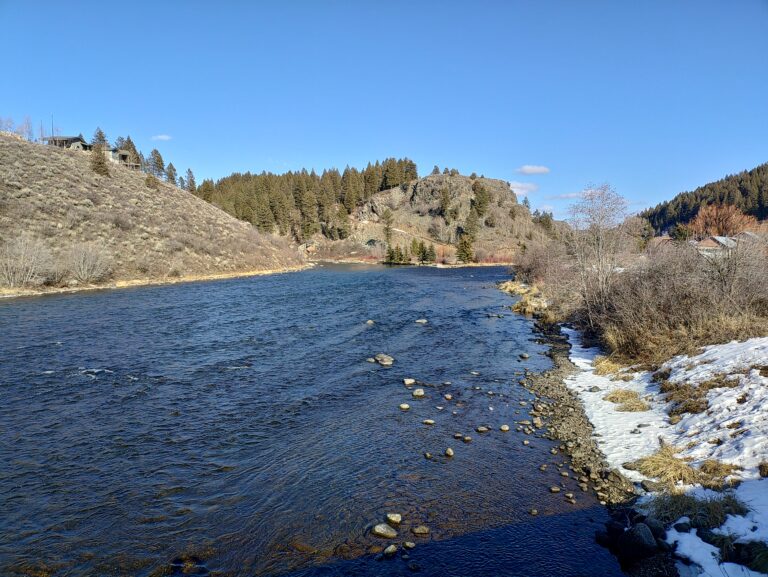
The photo above captures the unprecedented situation we face at the beginning of April. The photo, of the confluence of Warm River and the Henry’s Fork, was taken on February 7 and shows the shocking lack of snow we experienced in the watershed all winter as a result of record-breaking warm temperatures. How will the warm winter and lack of snow affect water supply, water quantity, and fisheries? The highlights are below. If you want to read the full 21-page report and see the numbers and graphs, click here. Mean October–March temperature was 5.6°F above average and 2.0° warmer than 2015, which was second warmest in the 1989–2026 record. Natural flow between Henry’s Lake and Island Park Dam was 4.5% higher over the winter than I predicted on October 1, due to much of the winter’s precipitation falling as rain instead of snow. Winter flow out of Island Park Dam averaged 215 cfs, compared with the 1989–2025 average of 349 cfs and an expectation of 170 cfs based on water supply. Snow water equivalent (SWE) peaked on March 16, 27 days earlier than average, at 67% of average, 3rd lowest on record. Natural streamflow is predicted to be the lowest