Water Quality
July 2026 Water Quality Forecast for Island Park
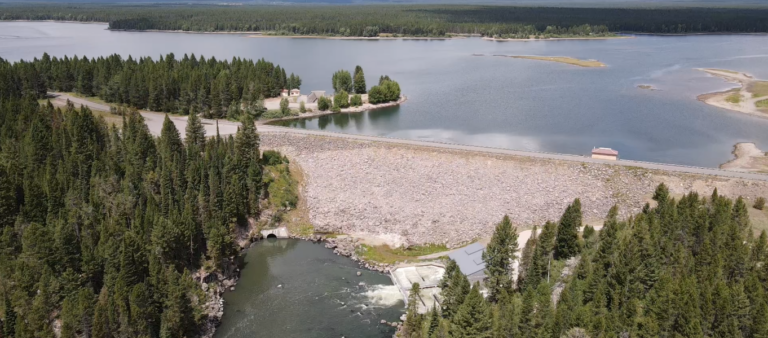
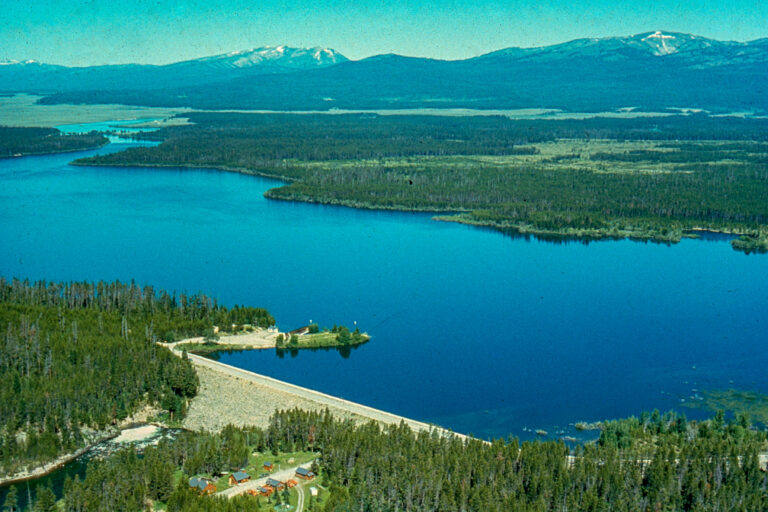
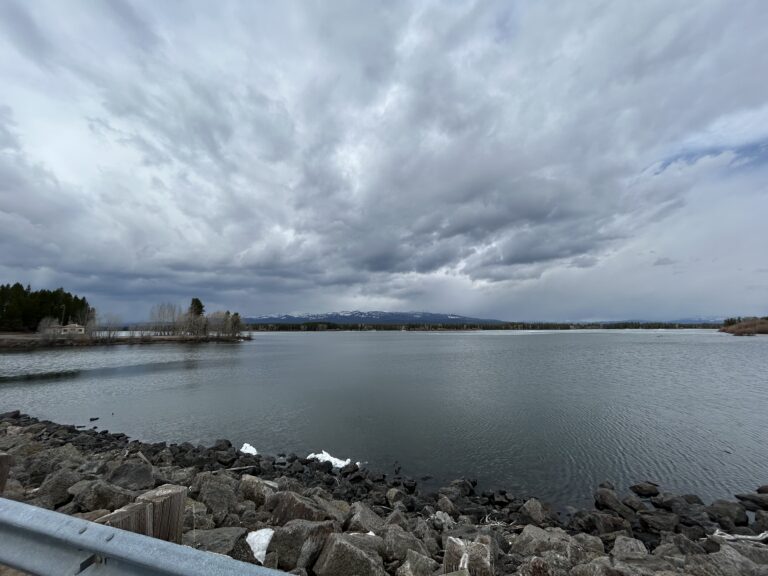
In early April, when ice melted off Island Park Reservoir one month earlier than usual, scientists at the Henry’s Fork Foundation (HFF) predicted an early onset of poor water quality conditions in Island Park Reservoir and the Henry’s Fork downstream. Warm air temperatures, low streamflow into the reservoir, and longer days with more sunlight are a recipe for algae blooms, the primary culprit of turbid water in Island Park. But we arrived at the end