This is the second installment of a five-part series investigating the various effects of receiving more precipitation as rain versus snow in the Henry’s Fork watershed. This installment was originally included in a daily water report sent March 5, 2024.
The big takeaway:
Today’s message is simple: when snow makes up a larger fraction of total precipitation, prediction of irrigation-season water supply is more precise.
The details:
One of the fundamental characteristics of water management in mountainous regions of the western U.S. is our ability to precisely predict water supply for the upcoming summer irrigation season. This high degree of predictability—historically, at least—is inherited from the dominance of summer-time streamflow by snowmelt. When peak snow water equivalent (SWE) occurs in April, the summer’s water supply is just sitting there on the ground, where we can easily measure it and therefore predict streamflow for the upcoming 6 months. Prediction of runoff timing is a little trickier, but traditionally, we have been able to predict total volume pretty well.
In extensive modeling of streamflow in the subwatersheds of the Henry’s Fork, Dr. Christina Morrisett found that in looking backwards at total summertime streamflow with complete data in hand, streamflow is best predicted by models that contain both SWE and summertime precipitation as inputs, along with some other climatic variables. However, in early April, when we need to predict water supply for irrigation and other needs for the upcoming summer, we do not know how much it is going to rain during the spring and summer and so need to predict streamflow only with SWE and other predictors that are known at the beginning of April.
It turns out that in water years in which SWE makes up a larger fraction of total precipitation, these models are more precise in predicting upcoming summer streamflow. In the 1989–2023 data set, the median fraction of precipitation accumulated in peak snowpack is 77%. For years with greater-than-median snow fraction, peak SWE explains 89% of the variability in upcoming April–September streamflow. For years with less-than-median snow fraction, peak SWE explains only 73% of variability in April–September streamflow. For the data set as a whole, SWE explains 82% of the variability in streamflow. Thus, as rain makes up a larger fraction of total precipitation, the precision in predicting streamflow from peak SWE goes down. The graph below shows that the scatter of points around the prediction curve is lower in the years with higher snow fraction.
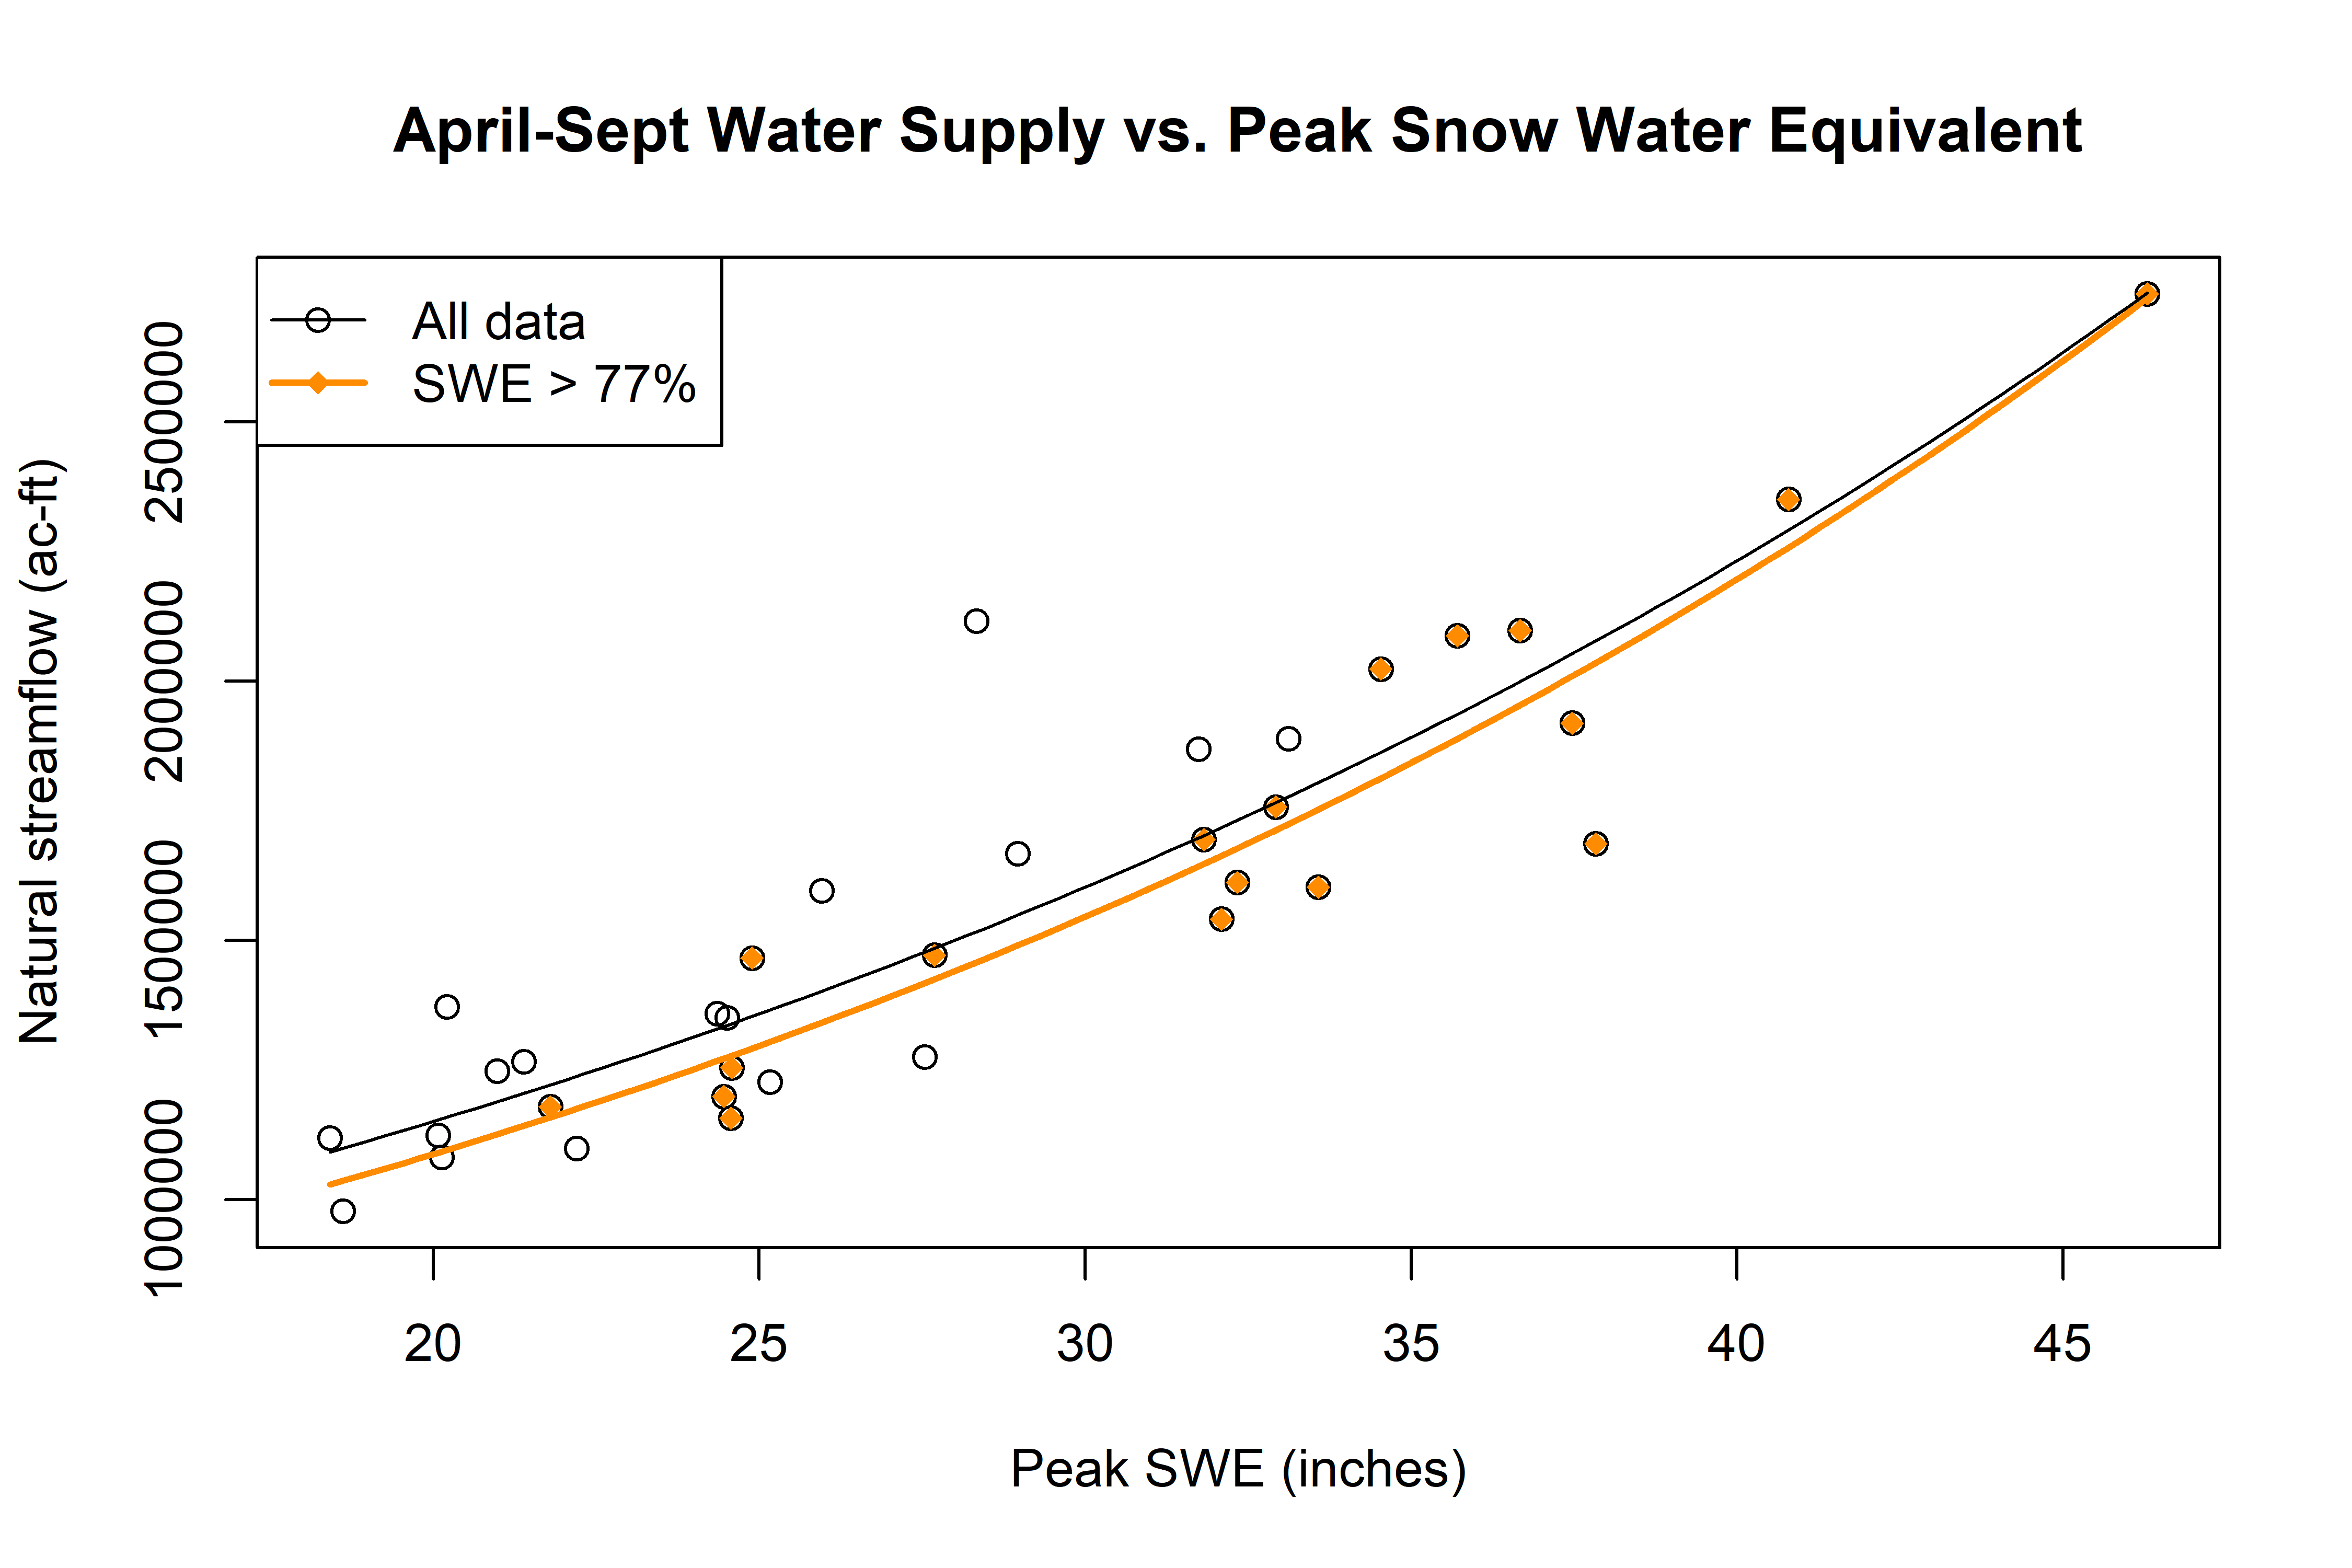
One obvious observation from the graph (and from intuition) is that when the snow fraction is lower (rain fraction is higher), total streamflow is a little higher. More rain in the spring and summer will generally increase streamflow a little bit relative to what it would have been based on snowpack alone. So, if in those rainy years we end up with a little more water than expected, what is the harm in that?
The answer has two parts. First, early-spring predictions are used by water managers to inform irrigators of their likely water supply, prior to planting. Agricultural producers make key decisions based on the anticipated water supply, and deviations from that supply in either direction can result in less-than-optimal cropping decisions. Second, early-spring predictions are critical to determining basin-wide springtime reservoir operations to balance multiple objectives. Having more water than expected because of spring rain usually results in less predictable reservoir operations, which are not optimal for water users, anglers, or hydropower operators. Anglers can readily understand this, as unexpected flow changes at Palisades Dam or Island Park Dam in the spring and early summer can disrupt fishing conditions during desirable hatches.
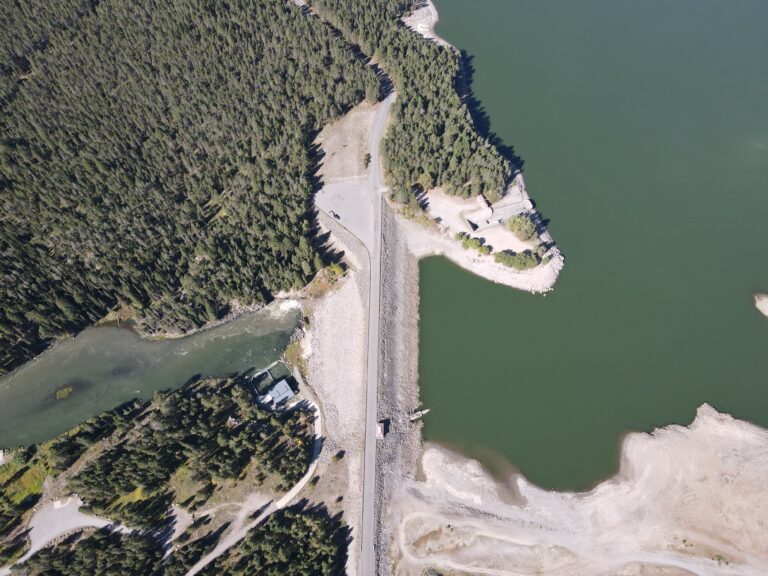
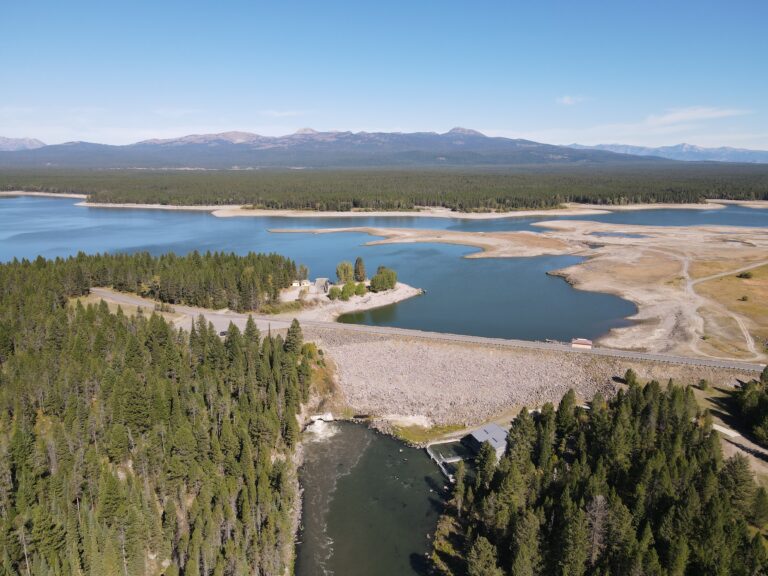
With respect to Island Park Reservoir in particular, when trying to maximize storage in the spring, runoff from a big rain must be passed through a full reservoir, requiring increased outflow. On the other hand, leaving room in the reservoir to capture that runoff risks losing some storage if rain doesn’t materialize, to the long-term detriment of both water users and fisheries. As I mentioned yesterday—and as is apparent from today’s graphic—the years with higher rainfall fractions are the years of lower water supply, when predictions and reservoir operations are most critical to optimizing water use. As rain makes up a larger fraction of precipitation, more precise management will be even more critical to make limited supply go farther, at the same time that our ability to predict supply and implement more careful management decreases.