This is the first installment of a five-part series investigating the various effects of receiving more precipitation as rain versus snow in the Henry’s Fork watershed. This installment was originally included in a daily water report sent March 4, 2024.
The big takeaway:
Water supply—both in total and as a fraction of precipitation that falls—is lower when a greater percentage of our precipitation falls as rain instead of snow.
The details:
Today’s message is centered around a multi-panel graphic. The curve in each panel is a simple single-variable statistical model fitted to the data points, and the P-value for that model is given. P-values less than 0.05 indicate statistical significance (less than 5% probability of observing a relationship between the two variables that strong by random chance). The data are from water years 1989–2023, except that I have adjusted the streamflow water year a little bit. Instead of using the regular October 1–September 30 water year for the streamflow variables, I have used the April 1–March 31 period because October–March streamflow is primarily dependent on precipitation that fell during the previous water year than it is on precipitation that falls that winter. This much better aligns streamflow with the precipitation that produces it, which is the whole story today. I have used streamflow so far at the beginning of water year 2024 in the analysis and prorated the winter portion so far through the end of March.
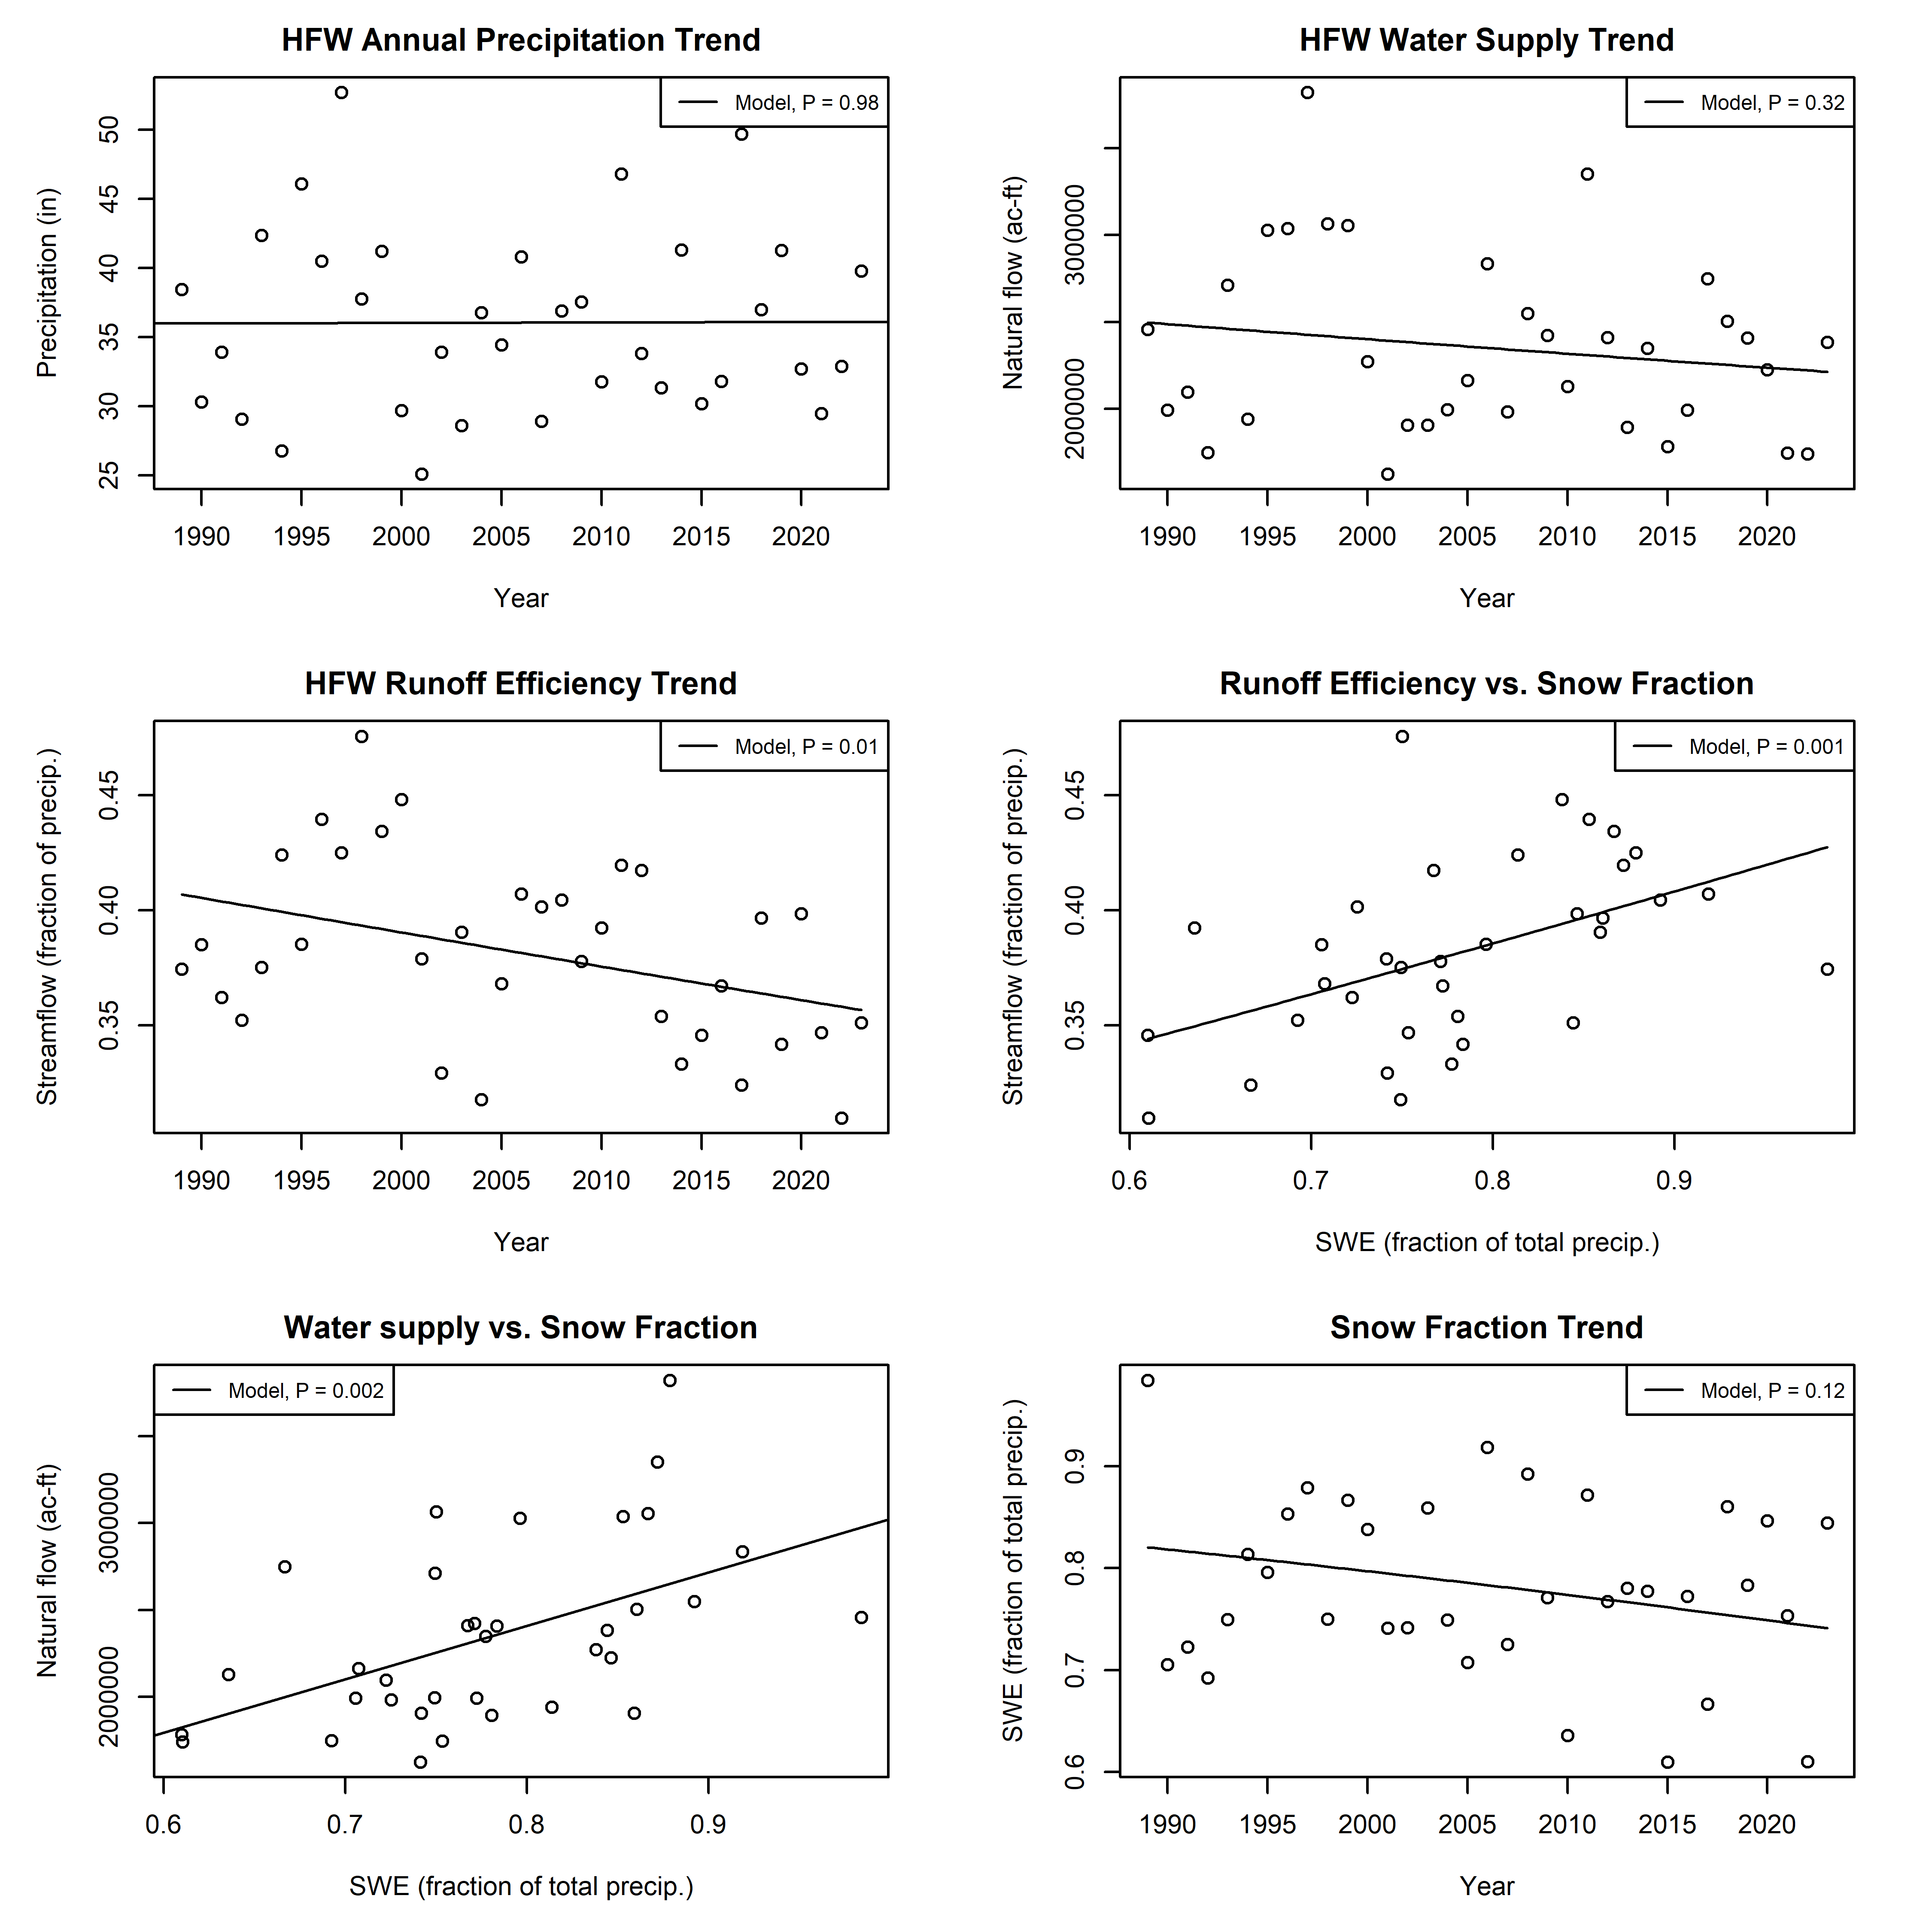
The top two panels show temporal trend in precipitation (top left) and in streamflow (top right) for the Henry’s Fork watershed as a whole. These are the same data I report every day when I refer to watershed-total precipitation or natural flow. As you can see, there has been no trend whatsoever in precipitation over the past 35 years. There is a slight decreasing trend in streamflow, although it is not statistically significant for the watershed as a whole. We have found a statistically significant decreasing trend in streamflow in the upper Henry’s Fork subwatershed, however, and the significance and strength of the trend depends on the time period over which the analysis is done. The biggest difference we see in water supply (natural streamflow) through time is comparing the 2001–2023 period to the 1965–2000 period in the upper Henry’s Fork (measured at Ashton). Water supply since 2001 is 18% lower than it was between 1965 and 2000. But for the purposes of this discussion today, make two notes: 1) precipitation in the watershed has not changed in 35 years, and 2) water supply is showing a mild decreasing trend, with a stronger trend in the upper Henry’s Fork and essentially no trend in Teton River and Fall River.
The second row of panels shows what we call “runoff efficiency,” which is the fraction of total precipitation that actually turns into streamflow. The rest is lost back to the atmosphere due to evapotranspiration and sublimation before it can make its way into the groundwater-surface water system. It’s important to note here that these figures are for natural streamflow only and do not account for reservoir storage and draft, irrigation diversion, crop evapotranspiration, or irrigation return flows. I’ll discuss those topics later in the week. Runoff efficiency is around 40% over the watershed but has been decreasing steadily and significantly over the past 35 years (middle left). Idaho State University PhD student Sarah Newcomb, who spent a year with HFF funded by the National Science Foundation, found this same trend using much more robust data sets and methods. She will submit her findings for peer-reviewed publication soon, and I’ll let you know when that ground-breaking research is published. Again, this trend is strongest in the upper Henry’s Fork subwatershed. The middle right panel of the graphic shows the dependence of runoff efficiency on the fraction of total water-year precipitation that falls as snow. That relationship is positive and the strongest of any shown in this graphic. This is the most important message of the day: when a larger fraction of precipitation falls as snow and is retained in the snowpack, the fraction of total precipitation that becomes streamflow is higher. Sarah’s research dug into the mechanistic details of this relationship and found that it is not simple, but generally, when more precipitation falls as rain, more of it falls when vegetation is growing and able to take up that precipitation before it can become streamflow.
The information in the top two rows is projected in the bottom row into the actual future implications of receiving more rain. The bottom left panel shows that water supply is higher when a larger fraction of total precipitation falls as snow, and this relationship is statistically significant. The opposite is also true: more rain leads to less streamflow. Finally, the bottom right panel shows that the fraction of total precipitation accumulated in the mountain snowpack is decreasing, although the water-scale trend is just a little short of being statistically significant.
This analysis is “back of the envelope:” I did it in an hour on a Sunday afternoon. It is robust but not nearly as sophisticated and detailed as what Sarah Newcomb did. Nonetheless, the message is clear: All precipitation is not created equal. Water supply—both as a fraction of precipitation and overall—is lower when a greater percentage of our precipitation falls as rain instead of snow. That means that even if total precipitation stays the same, we will have less streamflow if a higher percentage of that precipitation falls as rain, as trends indicate.