This is the fourth installment of a five-part series investigating the various effects of receiving more precipitation as rain versus snow in the Henry’s Fork watershed. This installment was originally included in a daily water report sent March 7, 2024.
The big takeaway:
Fish and other aquatic organisms are affected by life-history specific streamflow and habitat characteristics that are not simple, direct functions of water supply.
The details:
Today’s topic is very specific to trout and the aquatic insects they eat in the Henry’s Fork and not directly related to hydrology or water management. Those more interested in these topics are free to ignore this section today!
This series of discussions began when someone asked me whether fisheries in the Henry’s Fork were more strongly influenced by snow water equivalent (SWE) or by total precipitation. From the first three installments, you should be thinking that the answer is neither or both, and in any case, if streamflow is any indicator of fishery health, then water use and management have a larger role than where the water came from in the first place. And you would be right.
I am going to use two “simple” and relevant examples to illustrate the complexity of aquatic ecosystems and their response to streamflow and other environmental variables: the rainbow trout population in the Box Canyon reach of the Henry’s Fork, and the number of Pale Morning Dun (PMD, Ephemerella sp) mayflies across numerous reaches of the Henry’s Fork from Flat Rock to St. Anthony.
First consider the Box Canyon rainbow trout population. The first four-panel graphic today shows the trout population vs. several hydrologic variables. The hydrologic variables are measured over the water year prior to the annual trout population count, which is done by Idaho Department of Fish and Game (IDFG) in May. The R² value listed in each panel is the fraction of variability in the population number explained by the predictor variable. R² values range from 0 when the predictor variable has no effect on the response to 1 if the correlation was perfect. In ecology, which is messy, R² generally ranges from 0.45 to 0.65 in models that we consider fairly good. In physics and engineering, R² is usually much stronger, in the range of 0.75 to 0.95.
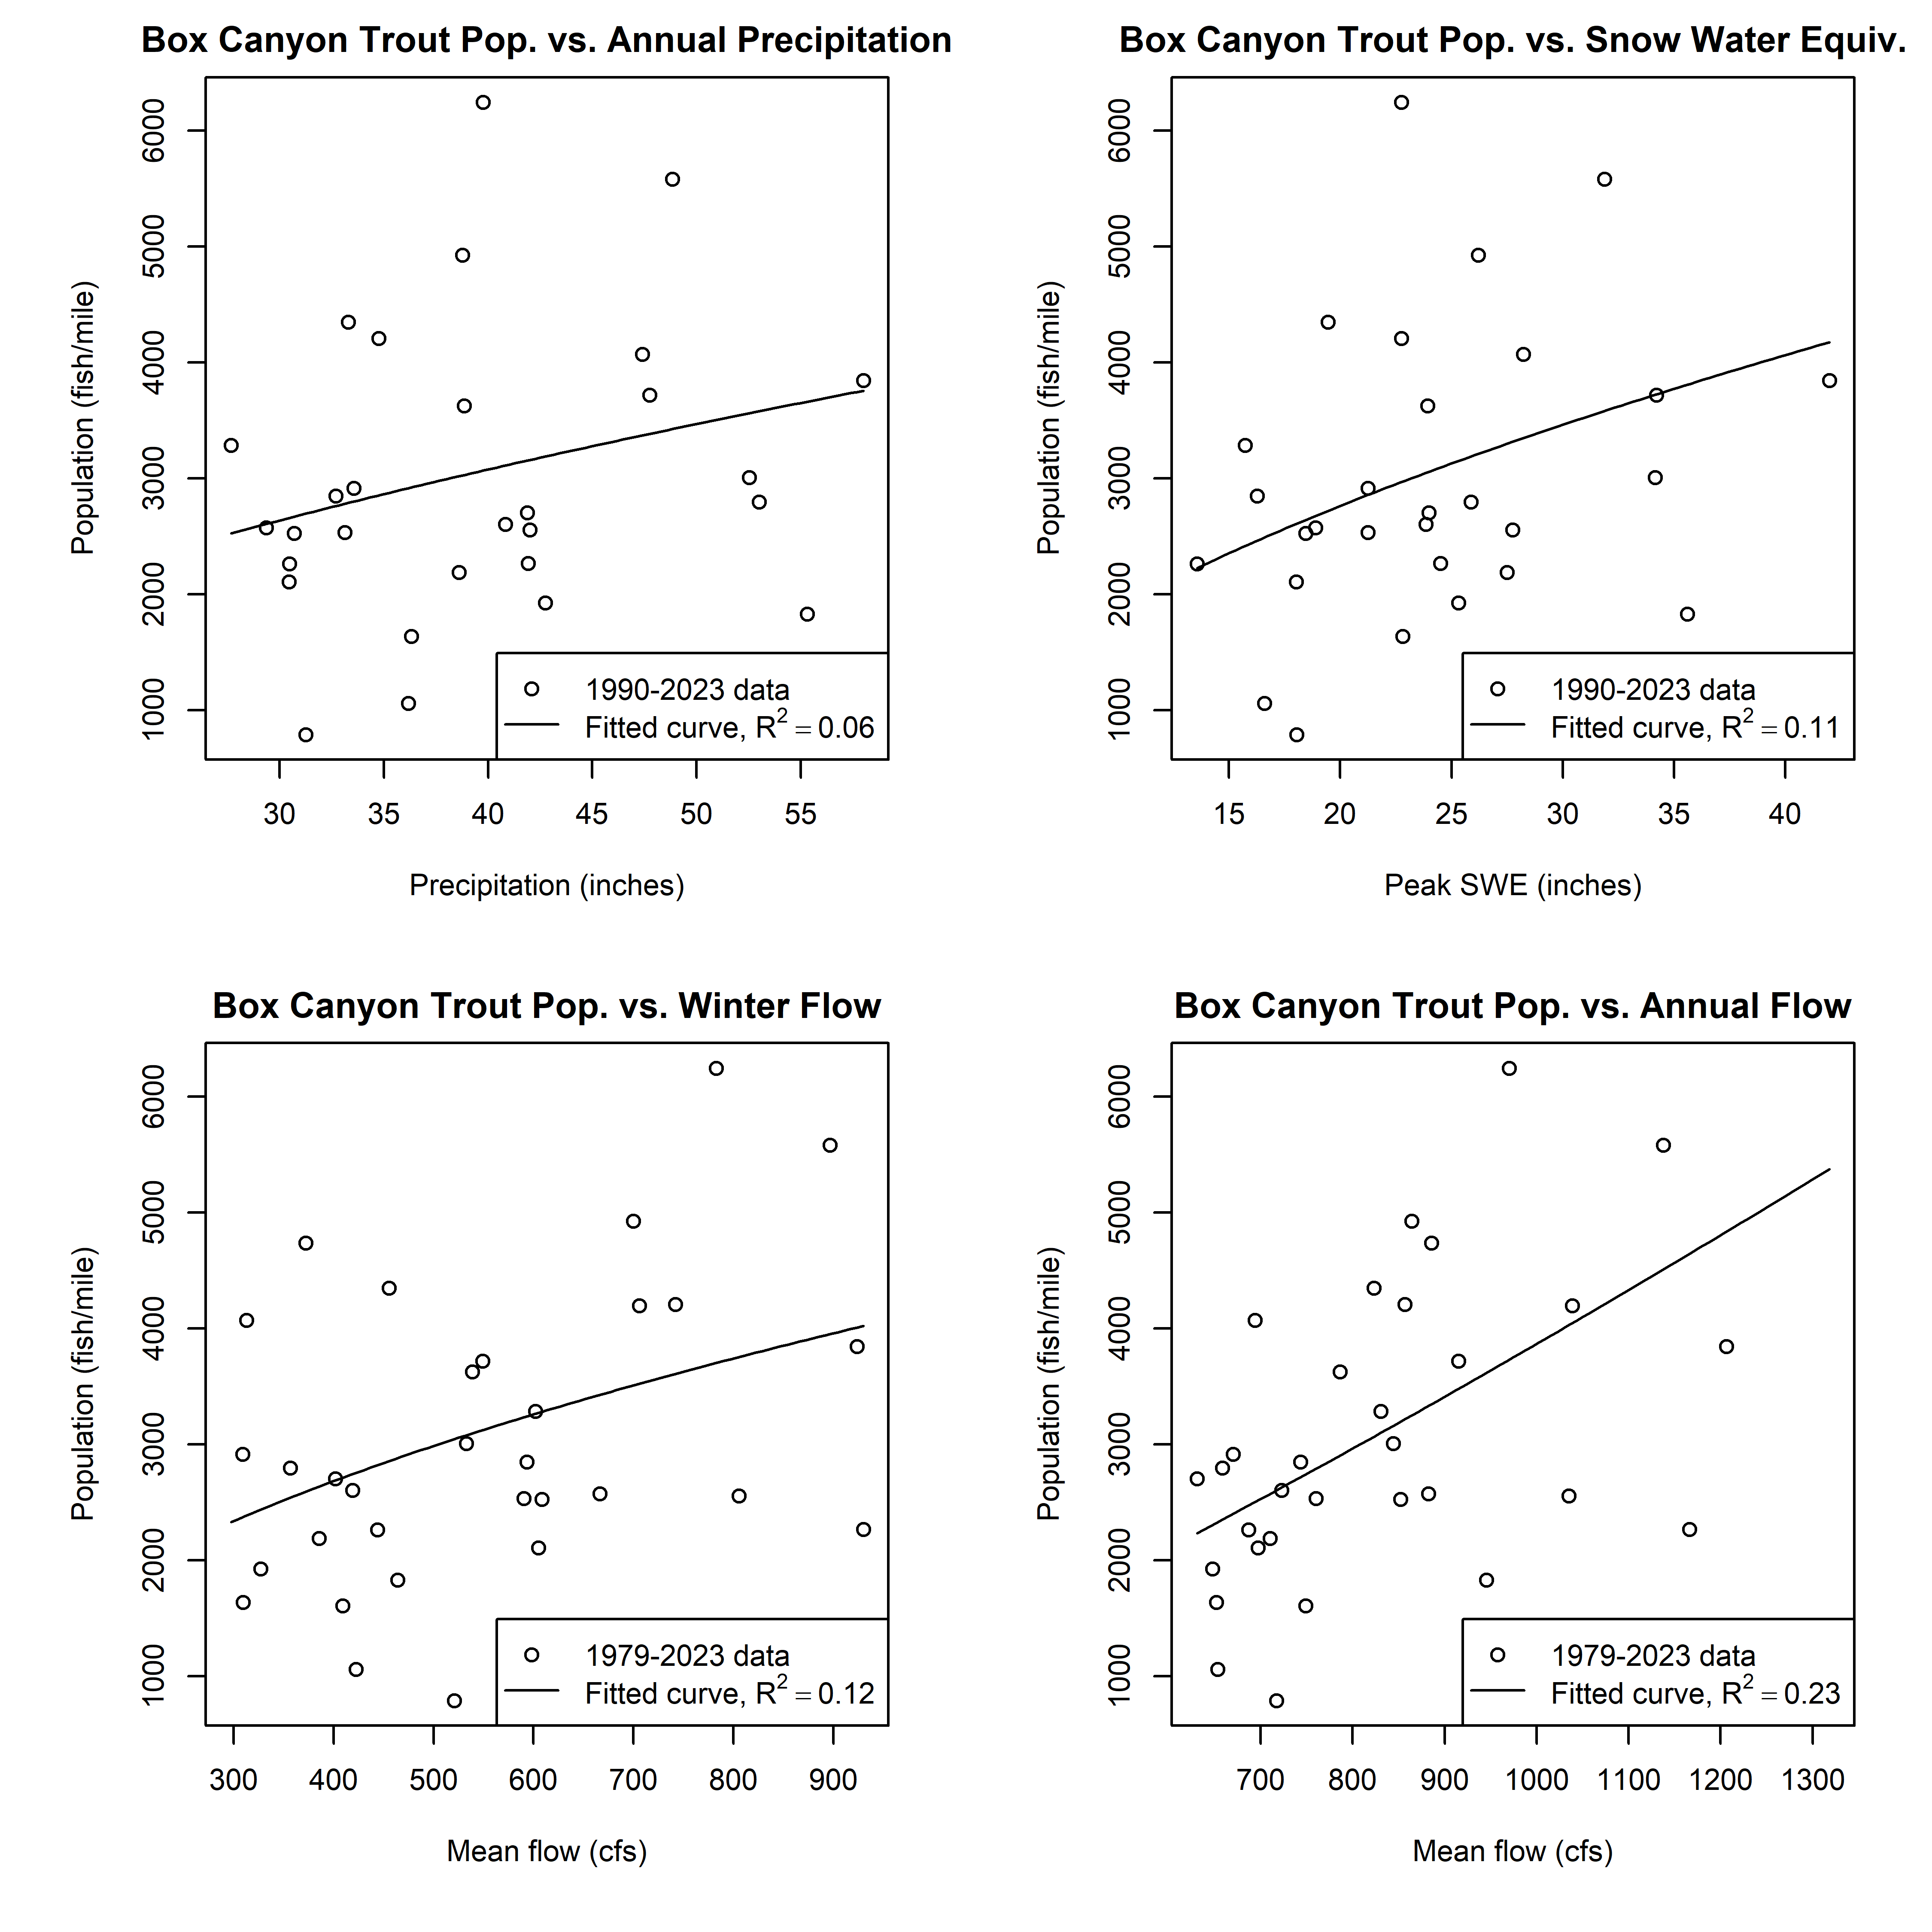
It is clear from the four panels in that graphic that the trout population is only weakly predicted by annual precipitation, SWE, winter streamflow, or annual streamflow. This is primarily because the population consists of cohorts of individual fish aged from 1 to 6, each of which experienced a different set of environmental conditions during their first year of life, when the majority of mortality occurs. Thus, a single hydrologic parameter measured over a single year cannot capture the accumulated experience of all individuals in the population at a given time. We have used weighted averages of key streamflow variables over previous years with some success, but even then, the explanatory power of these types of integrated measures on population numbers as a whole is modest at best.
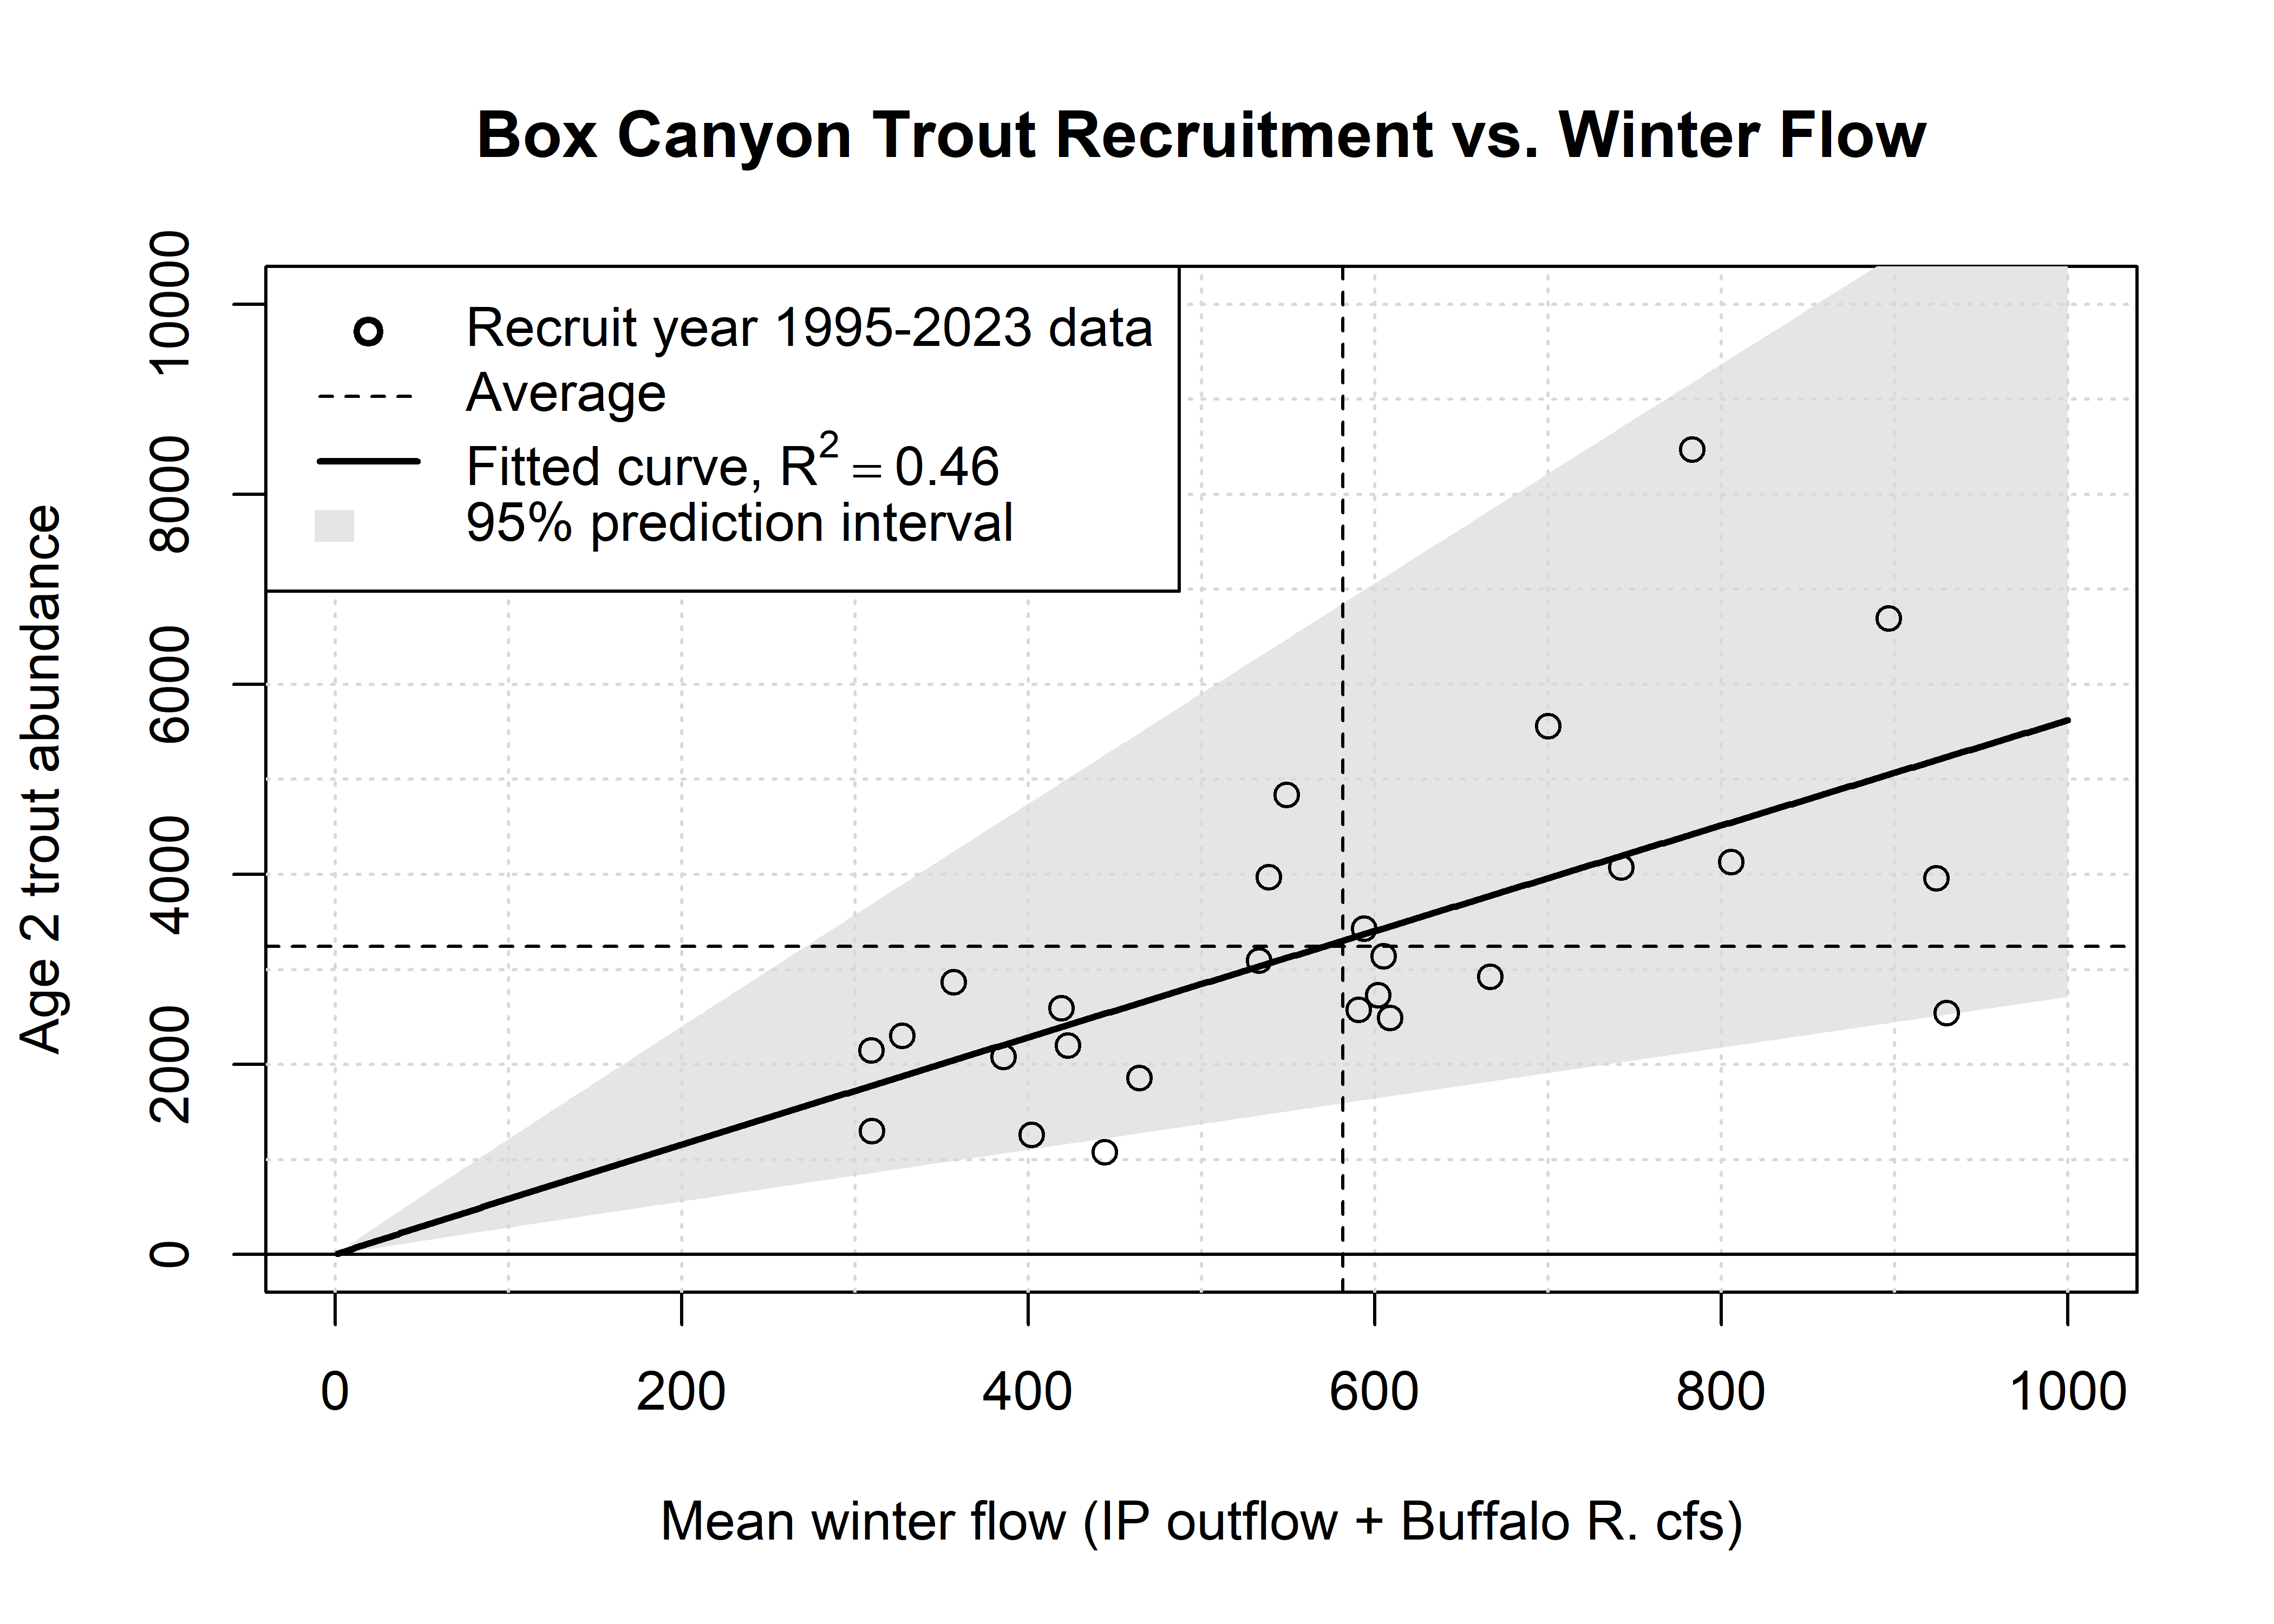
To find stronger relationships between water supply and fish populations, we need to look at survival of fish during their first year. As we have known for decades now, almost all of the mortality in a cohort of fish in Box Canyon (and most other river reaches) occurs during their first winter. Focusing just on that time period, we have looked over the years for numerous predictors, including temperature, precipitation, and streamflow. Every time we and our colleagues in IDFG look, we find the same result: the number of fish surviving their first two years to enter the population is positively dependent on streamflow during their first winter—and not on streamflow at any other time of the year or any other predictor. December–February streamflow in Box Canyon explains 46% of the variability in the number of two-year old trout entering the population the following year, as shown in the graphic below.
The second example illustrates that the abundance of other aquatic organisms such as insects is even more complex. In nine years of replicated, standardized sampling of aquatic invertebrates in the Henry’s Fork in six different locations, we have accumulated a sample of 45 unique site-year combinations that is allowing us to test hypotheses about insects in the Henry’s Fork using a much wider range of habitat conditions than we could observe at any one site even over a very long time period. As predictors of invertebrate abundance and community structure, we chose three streamflow variables—annual mean, 3-day maximum, and 21-day minimum—and three water-quality variables—conductivity (a surrogate for dissolved solids and overall productivity potential), suspended sediment, and 7-day maximum water temperature.
We sample in March of each year so that individuals of all species are large enough to be sampled, avoiding bias against species that recently emerged if we were to sample later in the spring or summer after annual hatches have begun. Thus, the water-quality predictors are applied over the previous year to capture the environment in which those individuals spent the majority of their life on the bottom of the river. Unlike trout, the majority of aquatic invertebrates in the Henry’s Fork live only one year, so it is easy to measure the environmental conditions in which those individuals sampled each March lived. And, it’s worth noting that the vast majority of aquatic insects that anglers value on the Henry’s Fork spend 99% of their life on the stream bottom and 1% in the terrestrial environment. It’s that 1% that creates the hatches for which the Henry’s Fork is famous, but we sample the 99% because it reflects overall aquatic ecosystem function in the river.
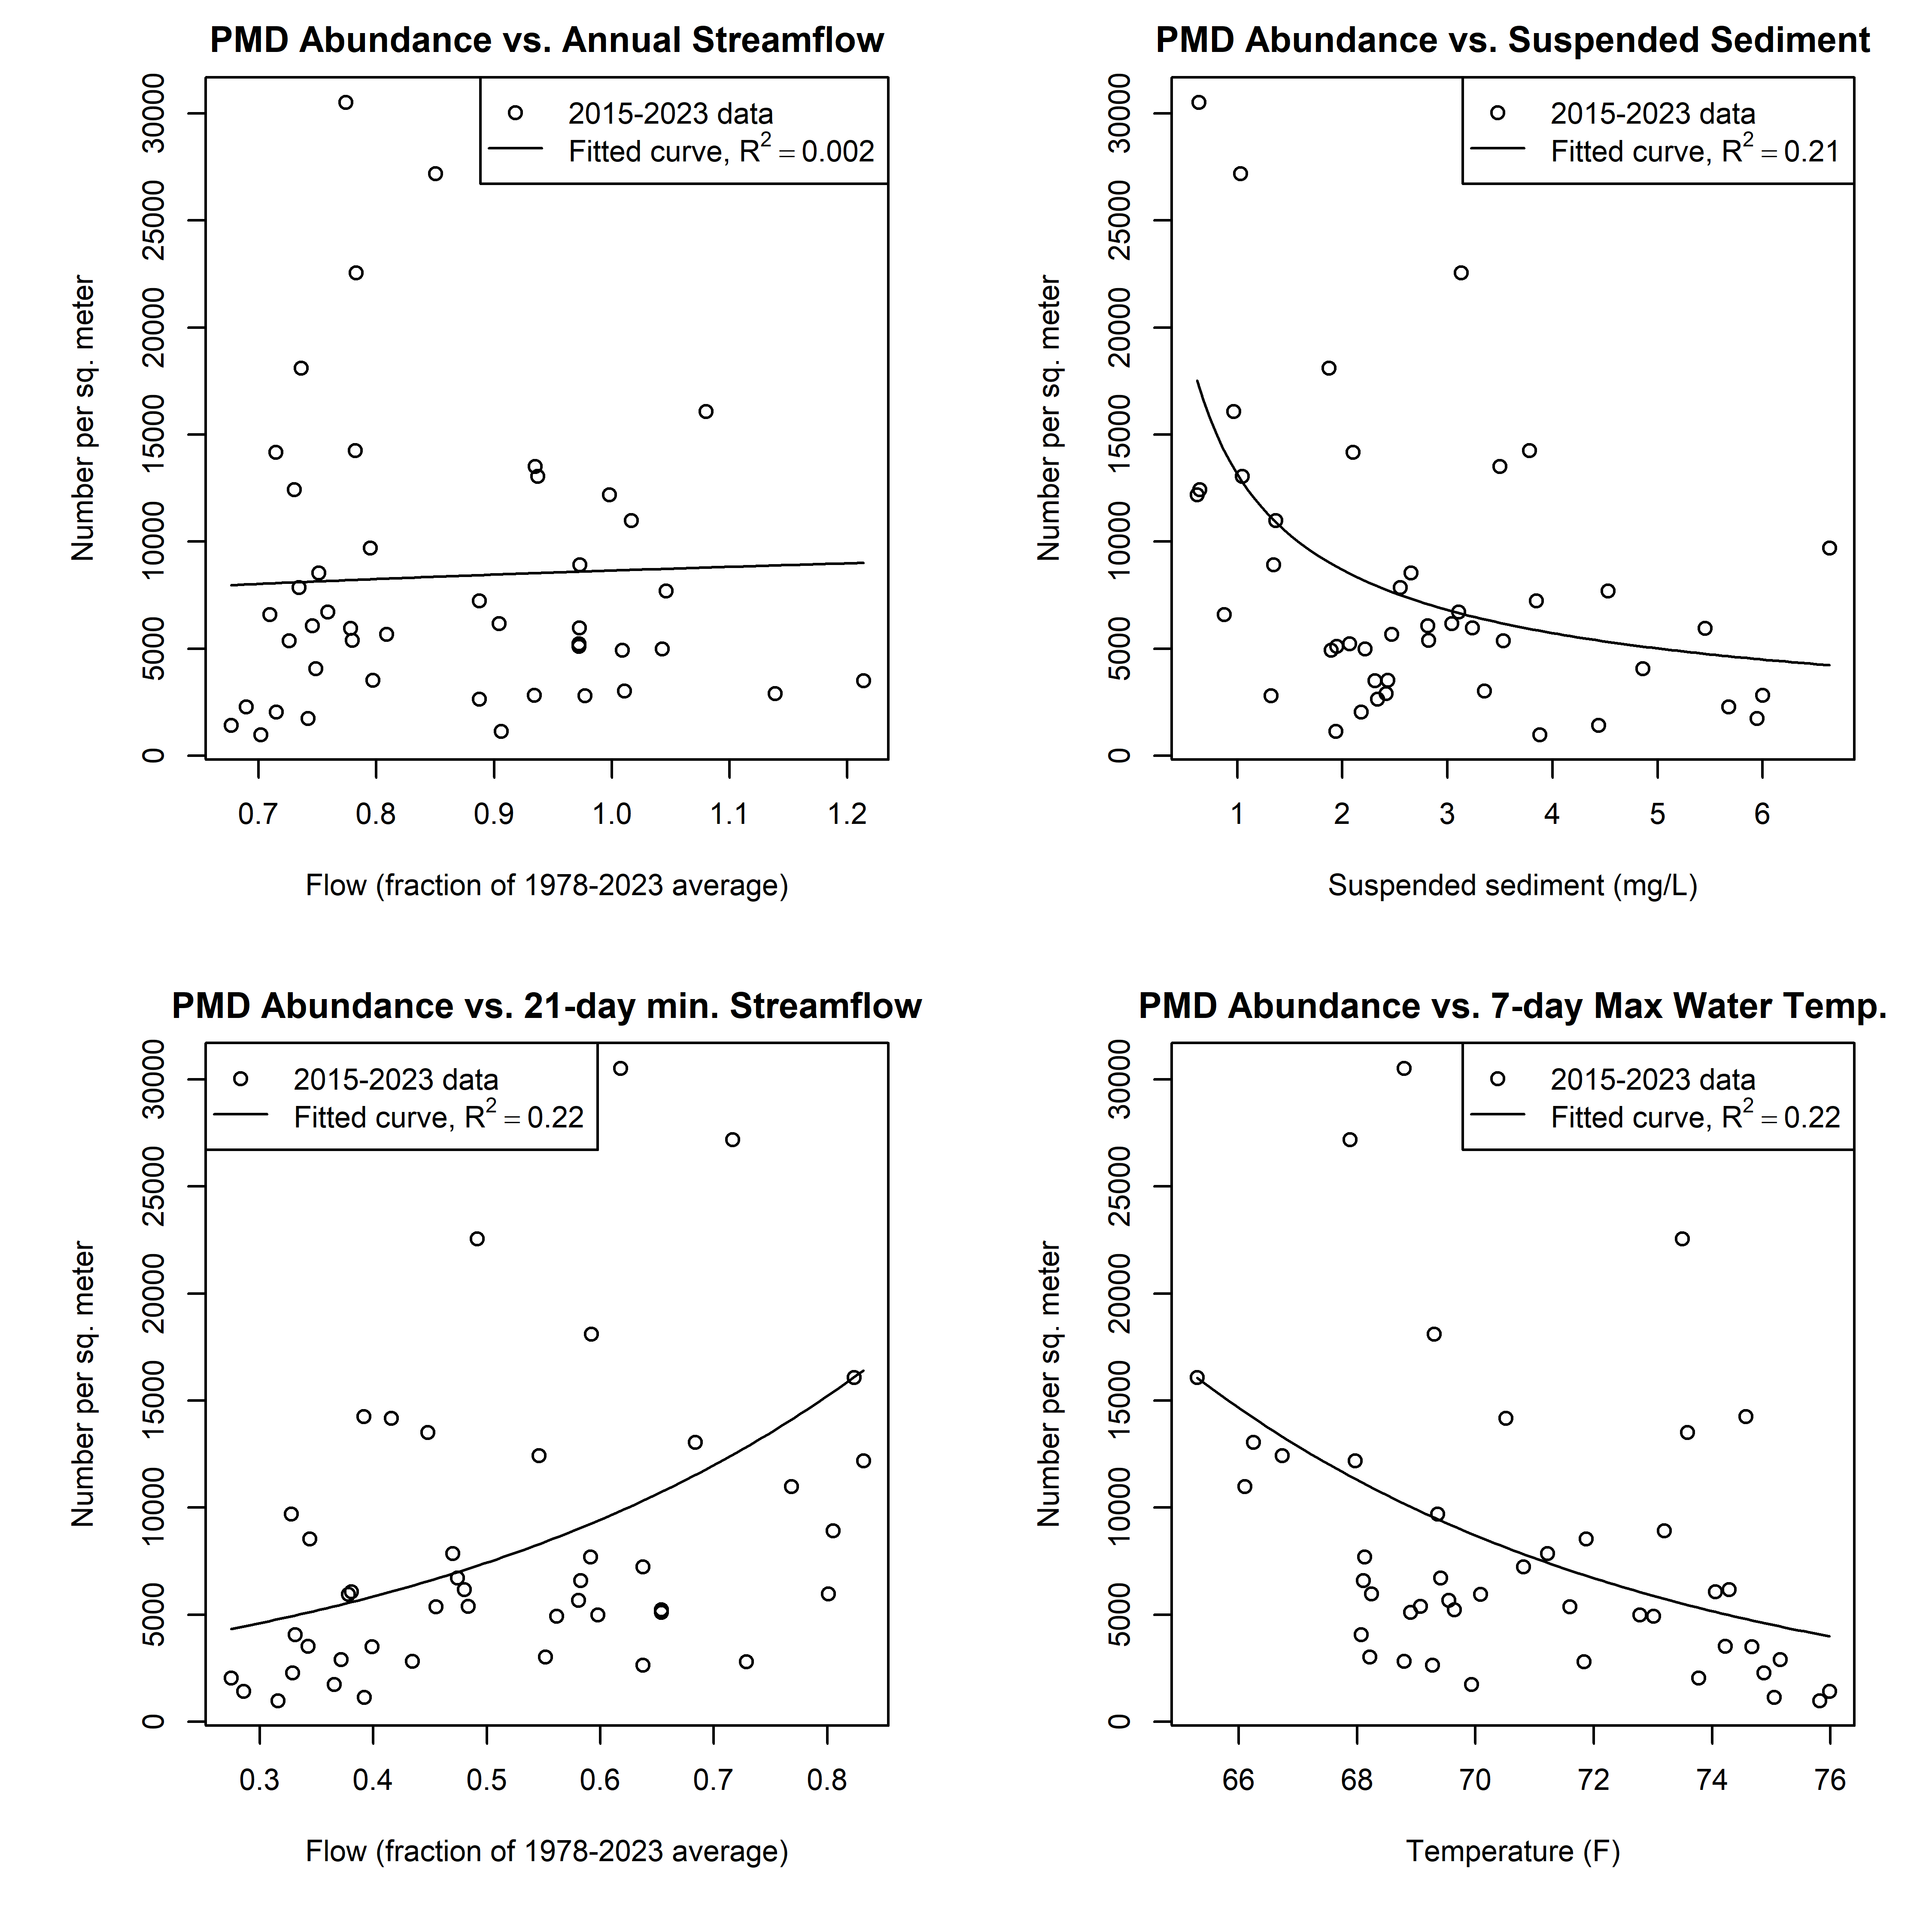
In general, we found that no one of the variables on its own was a strong predictor. This is well illustrated by abundance of PMDs, as shown in the last graphic. PMD abundance was not at all related to annual streamflow and only weakly (R² = 0.2) on each of suspended sediment concentration, annual minimum streamflow, and maximum water temperature. As you would expect, PMD numbers are higher at lower sediment concentrations, higher minimum streamflow, and cooler water temperatures. The best predictive models (R² = 0.25–0.45; still weak to modest at best) for PMDs and most of the other invertebrate metrics we analyzed included combinations of the predictors, most often one or two of the streamflow variables, sediment concentration, and temperature. Of those, maximum water temperature appeared most frequently in statistically good predictive models and was more often the strongest single predictor.
So, that leads to tomorrow’s final installment, which will discuss the effects of increased temperature. After all, the physical mechanism producing more rain, less snow, and lower runoff efficiency—despite no change in total precipitation—is increased temperature.