UPDATE: With only one month left in the 2024 water year, let’s take a look back at Water Year 2023, and get a preview of the types of info we can expect for 2024’s report.
Summary
Climate.
Peak snow water equivalent (SWE) was 119% of average and 8th highest in the 1989–2023 record, and SWE peaked on April 24, 12 days later than average. Temperatures were very cold for most of the winter and early spring but well above average in May and July. For the water year, mean temperature was 1°F below average. Water-year total precipitation was 111% of average thanks to heavy precipitation in August and September. Short- and medium-term drought indicators improved substantially over the water year.
Natural flow.
Natural streamflow was 92% of average, ranking 28th out of 46 years in the 1978–2023 record. By subwatershed, natural flow was 85% of the 1978–2022 average in upper Henry’s Fork, 91% in Fall River, and 99% in Teton River. In the long upper Henry’s Fork record, natural flow was 90% of average, ranking 69th out of the last 94 years. April–September natural flow was equal the 1978–2022 average, and April-September hydrograph center-of-mass, a measure of runoff timing, was within 1 day of average. For the watershed as a whole, natural flow has been above the 1978–2022 average in 8 of the past 23 years, compared with 12 of the 23 years prior.
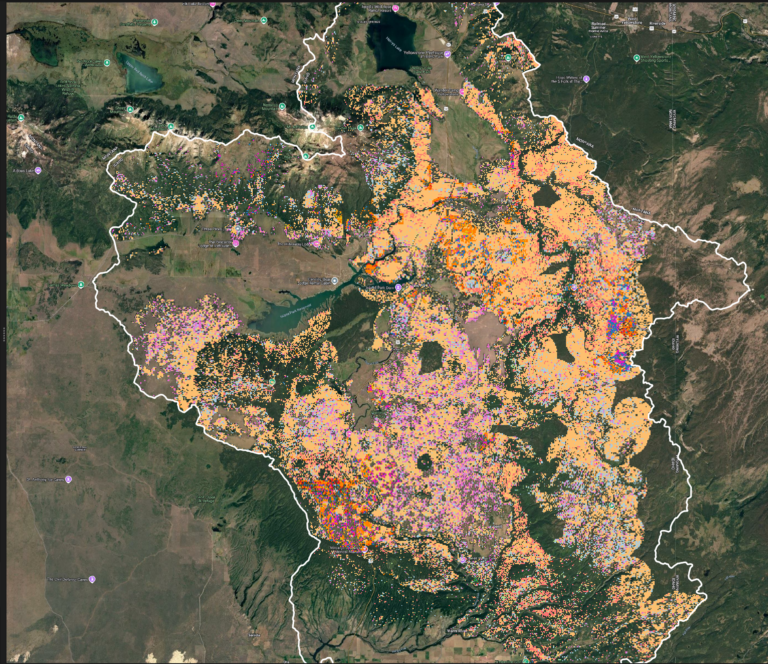
Irrigation management.
Because of good snowpack across the Snake River basin in 2023, all storage rights in Henry’s Lake, Island Park Reservoir and Grassy Lake filled for the first time since 2020. Thus, irrigators in the Henry’s Fork watershed were not limited by administrative water availability in 2023 as was the case in 2021 and 2022. Irrigation demand was high in July due to a combination of warm temperatures, low precipitation, and maturation of all crop types across most of the watershed at the same time. This resulted in the highest mid-summer outflow from Island Park Reservoir since 2015. However cool and wet weather early in the spring and rain in August and September kept demand low on either side of the peak. Total diversion was 88% of the 2001–2022 average and the lowest since modern record-keeping began in 1978.
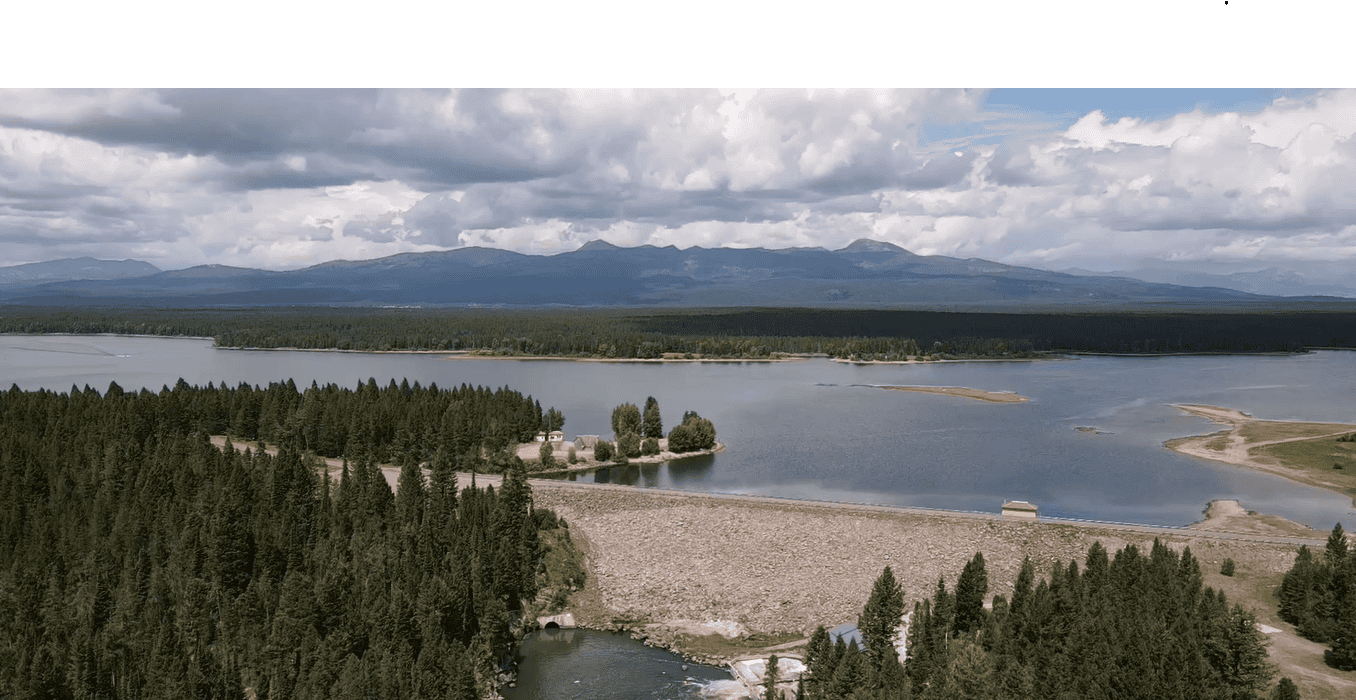
Island Park Reservoir management.
Winter inflow to Island Park Reservoir was 6th lowest in the 1934–2022 record, and the outflow of 213 cfs ranked 33rd out of the last 46 years since 1978. A three-day freshet was conducted in late April, with outflow around 2,000 cfs. Island Park Reservoir filled physically in mid-June. Reservoir draft started on July 2 (three days later than average) and ended on August 25 (the earliest end-date on record). The reservoir reached its minimum for the year on August 25 at 62% full, compared with 45% full on average. Since 2018, a variety of water-management and conservation measures have resulted in an average annual increase in physical reservoir carryover of 26,000 ac-ft (50%) and in winter outflow from Island Park Dam of 115 cfs (43% improvement through the 2022/2023 winter), compared to what would have been expected based on pre-2018 management. Administrative carryover of North Fork Reservoir Company and Fremont-Madison Irrigation District storage has averaged 22,642 ac-ft (24.2%) higher since 2018 than during 2001-2017.
Stream gaging.
Mean relative error of HFF streamflow measurements at Island Park compared to USGS adjusted flow was 5.6%, with HFF measurements biased high by 0.9%. HFF made 6 measurements at Ashton, with a mean error of 5.8% relative to USGS data and a bias of -0.7%. Thus, our measurements provided accurate real-time estimates of streamflow to river and water users during time periods between USGS measurements.
Accuracy of predictive models.
October-1 prediction of upcoming winter streamflow was within 2% of the observed value, although Island Park Reservoir fill was well below the predicted value until mid-winter, when precipitation on the reservoir surface finally offset lack of fill earlier in the fall due to lower-watershed streamflow constraints. The April-1 prediction of total April-September streamflow volume was only 5.7% higher than observed, but models performed poorly at capturing late snowmelt and compression of runoff into a short period in May. Predictions of June-September streamflow in all three subwatersheds were very accurate. Models of irrigation-season management came within a few days of predicting the first day of need for reservoir draft and Crosscut Canal delivery but underestimated irrigation demand and need for reservoir draft during the middle of the summer. However, by the end of the summer, Island Park Reservoir and Henry’s Lake volume fell within the middle 85% of model outcomes.
Water quality.
All measures of water quality were much better in 2023 than in 2022, thanks to above-average snowpack, very late melt of ice from Island Park Reservoir, moderate summer air temperatures, and cloudy, showery weather from early August through October. Water temperatures were below average at most locations until early July and exceeded average for extended periods only in late summer and fall, after the season’s peaks had already been reached. Daily average dissolved oxygen concentrations were within suitable ranges for trout at all locations all summer. Over 2,000 tons of sediment were exported from the reach between Island Park Dam and Pinehaven during 2023—the highest since we fully instrumented that river reach in 2016. Half of that sediment was exported during the April 25-28 freshet. Turbidity was consistently below average at Island Park Dam and Pinehaven after the effects of the freshet operation and natural snowmelt had passed. Analysis of 10 years of HFF data and a new data set provided by the U.S. Geological Survey show that the three most important predictors of summertime water quality in the reservoir and the river downstream are reservoir outflow (higher outflow = worse water quality), natural flow (higher water supply = better water quality), and March-May air temperatures (warmer temperatures = worse water quality).
Aquatic invertebrates.
Data collected in 2023 showed substantial improvement in almost all measures of the invertebrate community at Last Chance and Osborne Bridge, relative to 2021 and 2022. Percent mayflies, stoneflies and caddisflies at Last Chance was over 70%, the highest we have observed there. These significant improvements occurred in a year when anglers reported some of the poorest hatches ever experienced, illustrating that stream-bottom invertebrate population metrics are not equivalent to hatches. Further, adding 2023 data to the long-term set showed that variability in the invertebrate community is higher immediately downstream of Island Park Reservoir than either upstream at Flat Rock or far downstream at Marysville, but that dependence of invertebrates on Island Park Reservoir water quality and flow management is not simple.
The Full Report
Click to view. 80 pages.