Diversion from the Henry’s Fork has decreased 30% over the past 40 years, yet consumptive use of water by crops has increased, there is less water in the river during the middle of irrigation season, and use of storage water has increased, all other things being equal. How could this be?
In Idaho, administration of irrigation water takes place over the “irrigation year,” which runs from November 1 to October 31, lagging the more common October 1 to September 30 “water year” by a month. In most areas of the upper Snake River basin, irrigation water rights can be used from April 1 to October 31. Water for other uses, such as managed aquifer recharge and livestock watering, can occur during the winter. Irrigation year 2018 ended just a little over one month ago, allowing me a little time to summarize data from the 2018 irrigation season. This blog starts out with that summary but quickly moves into a discussion of long-term trends in irrigation practices, and the unintended and counterintuitive consequences of those trends.
Data Sources
The data reported here come from the Idaho Department of Water Resources (IDWR) water-rights accounting database. These data include all all points of diversion that are metered in real time. In the Henry’s Fork watershed, this is all major canals on Fall River, the Henry’s Fork downstream of Ashton, and Teton River downstream of the Teton Dam site. The large pumps in the Teton River Canyon and on the lower Teton River are also included in the current data set. Statistics reported here are based on these diversions. Smaller pumps are not metered in real time, and data for those will not be available until later this winter. Also, the IDWR electronic database does not include diversions in Teton Valley, in Island Park, and on a few small tributaries west of Ashton. The total amount of water diverted in these areas and by the small pumps is around 10% of the total diverted in the whole watershed.
Diversion in the Henry’s Fork Watershed in 2018
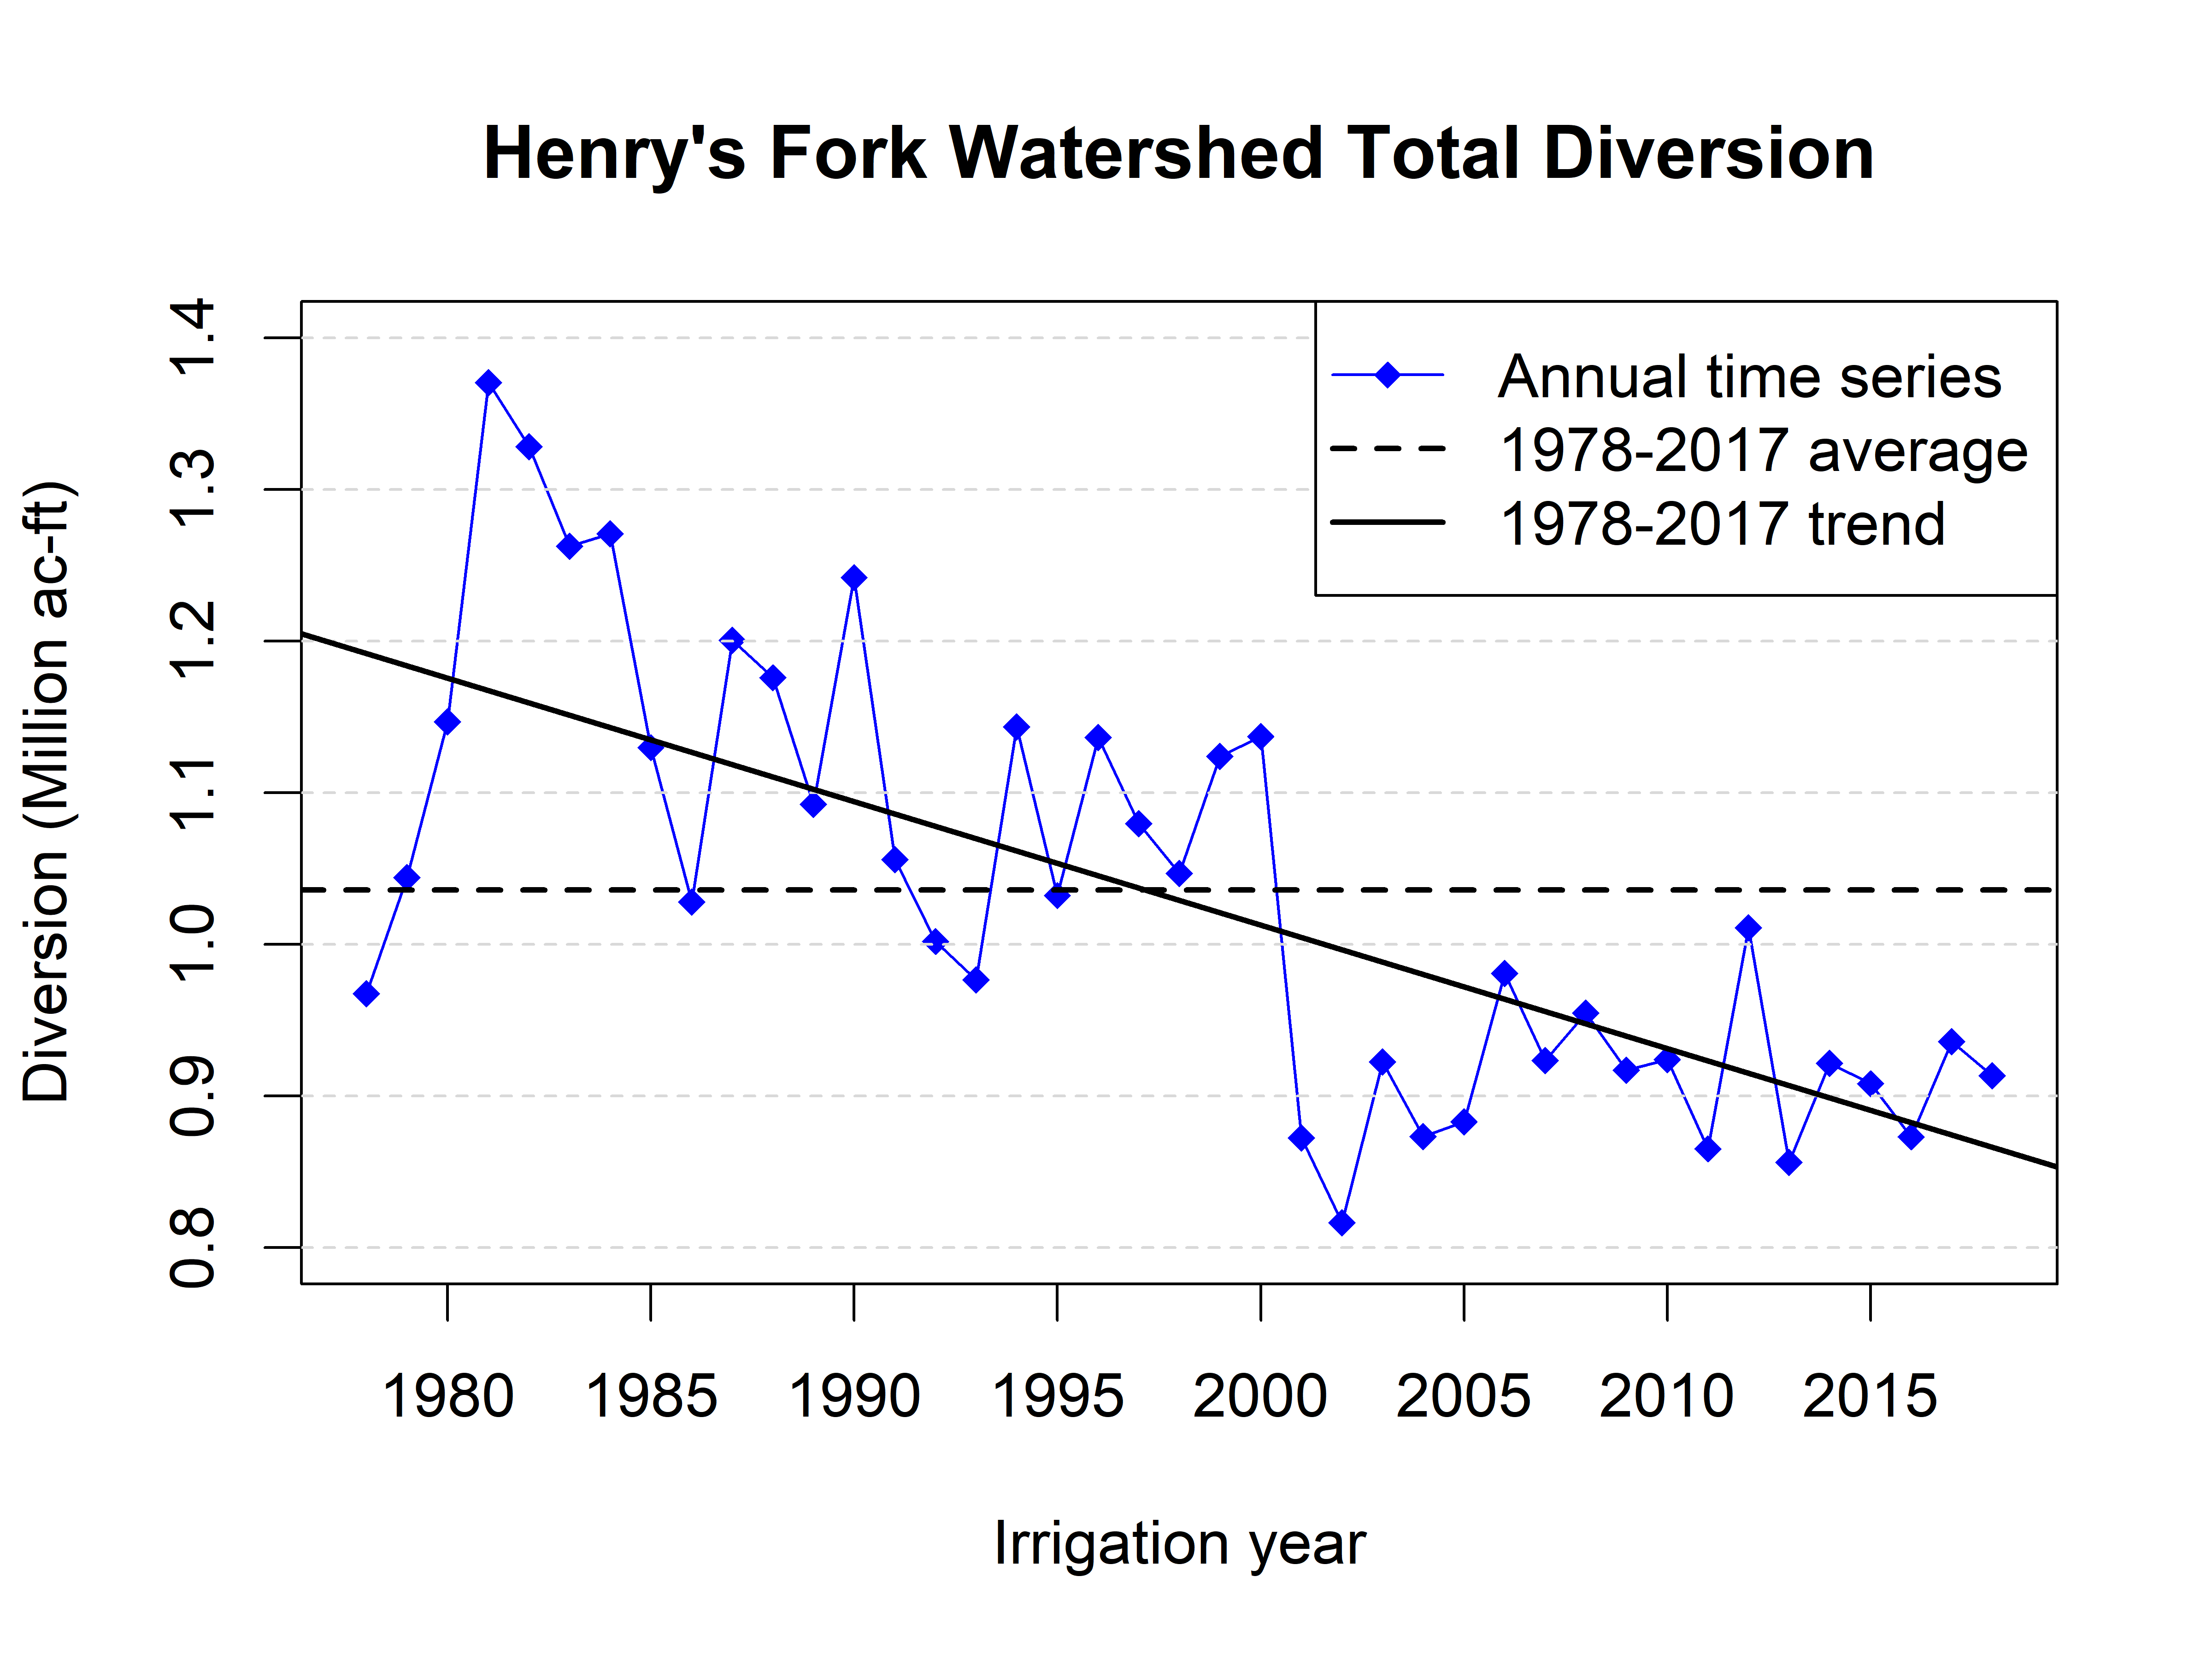
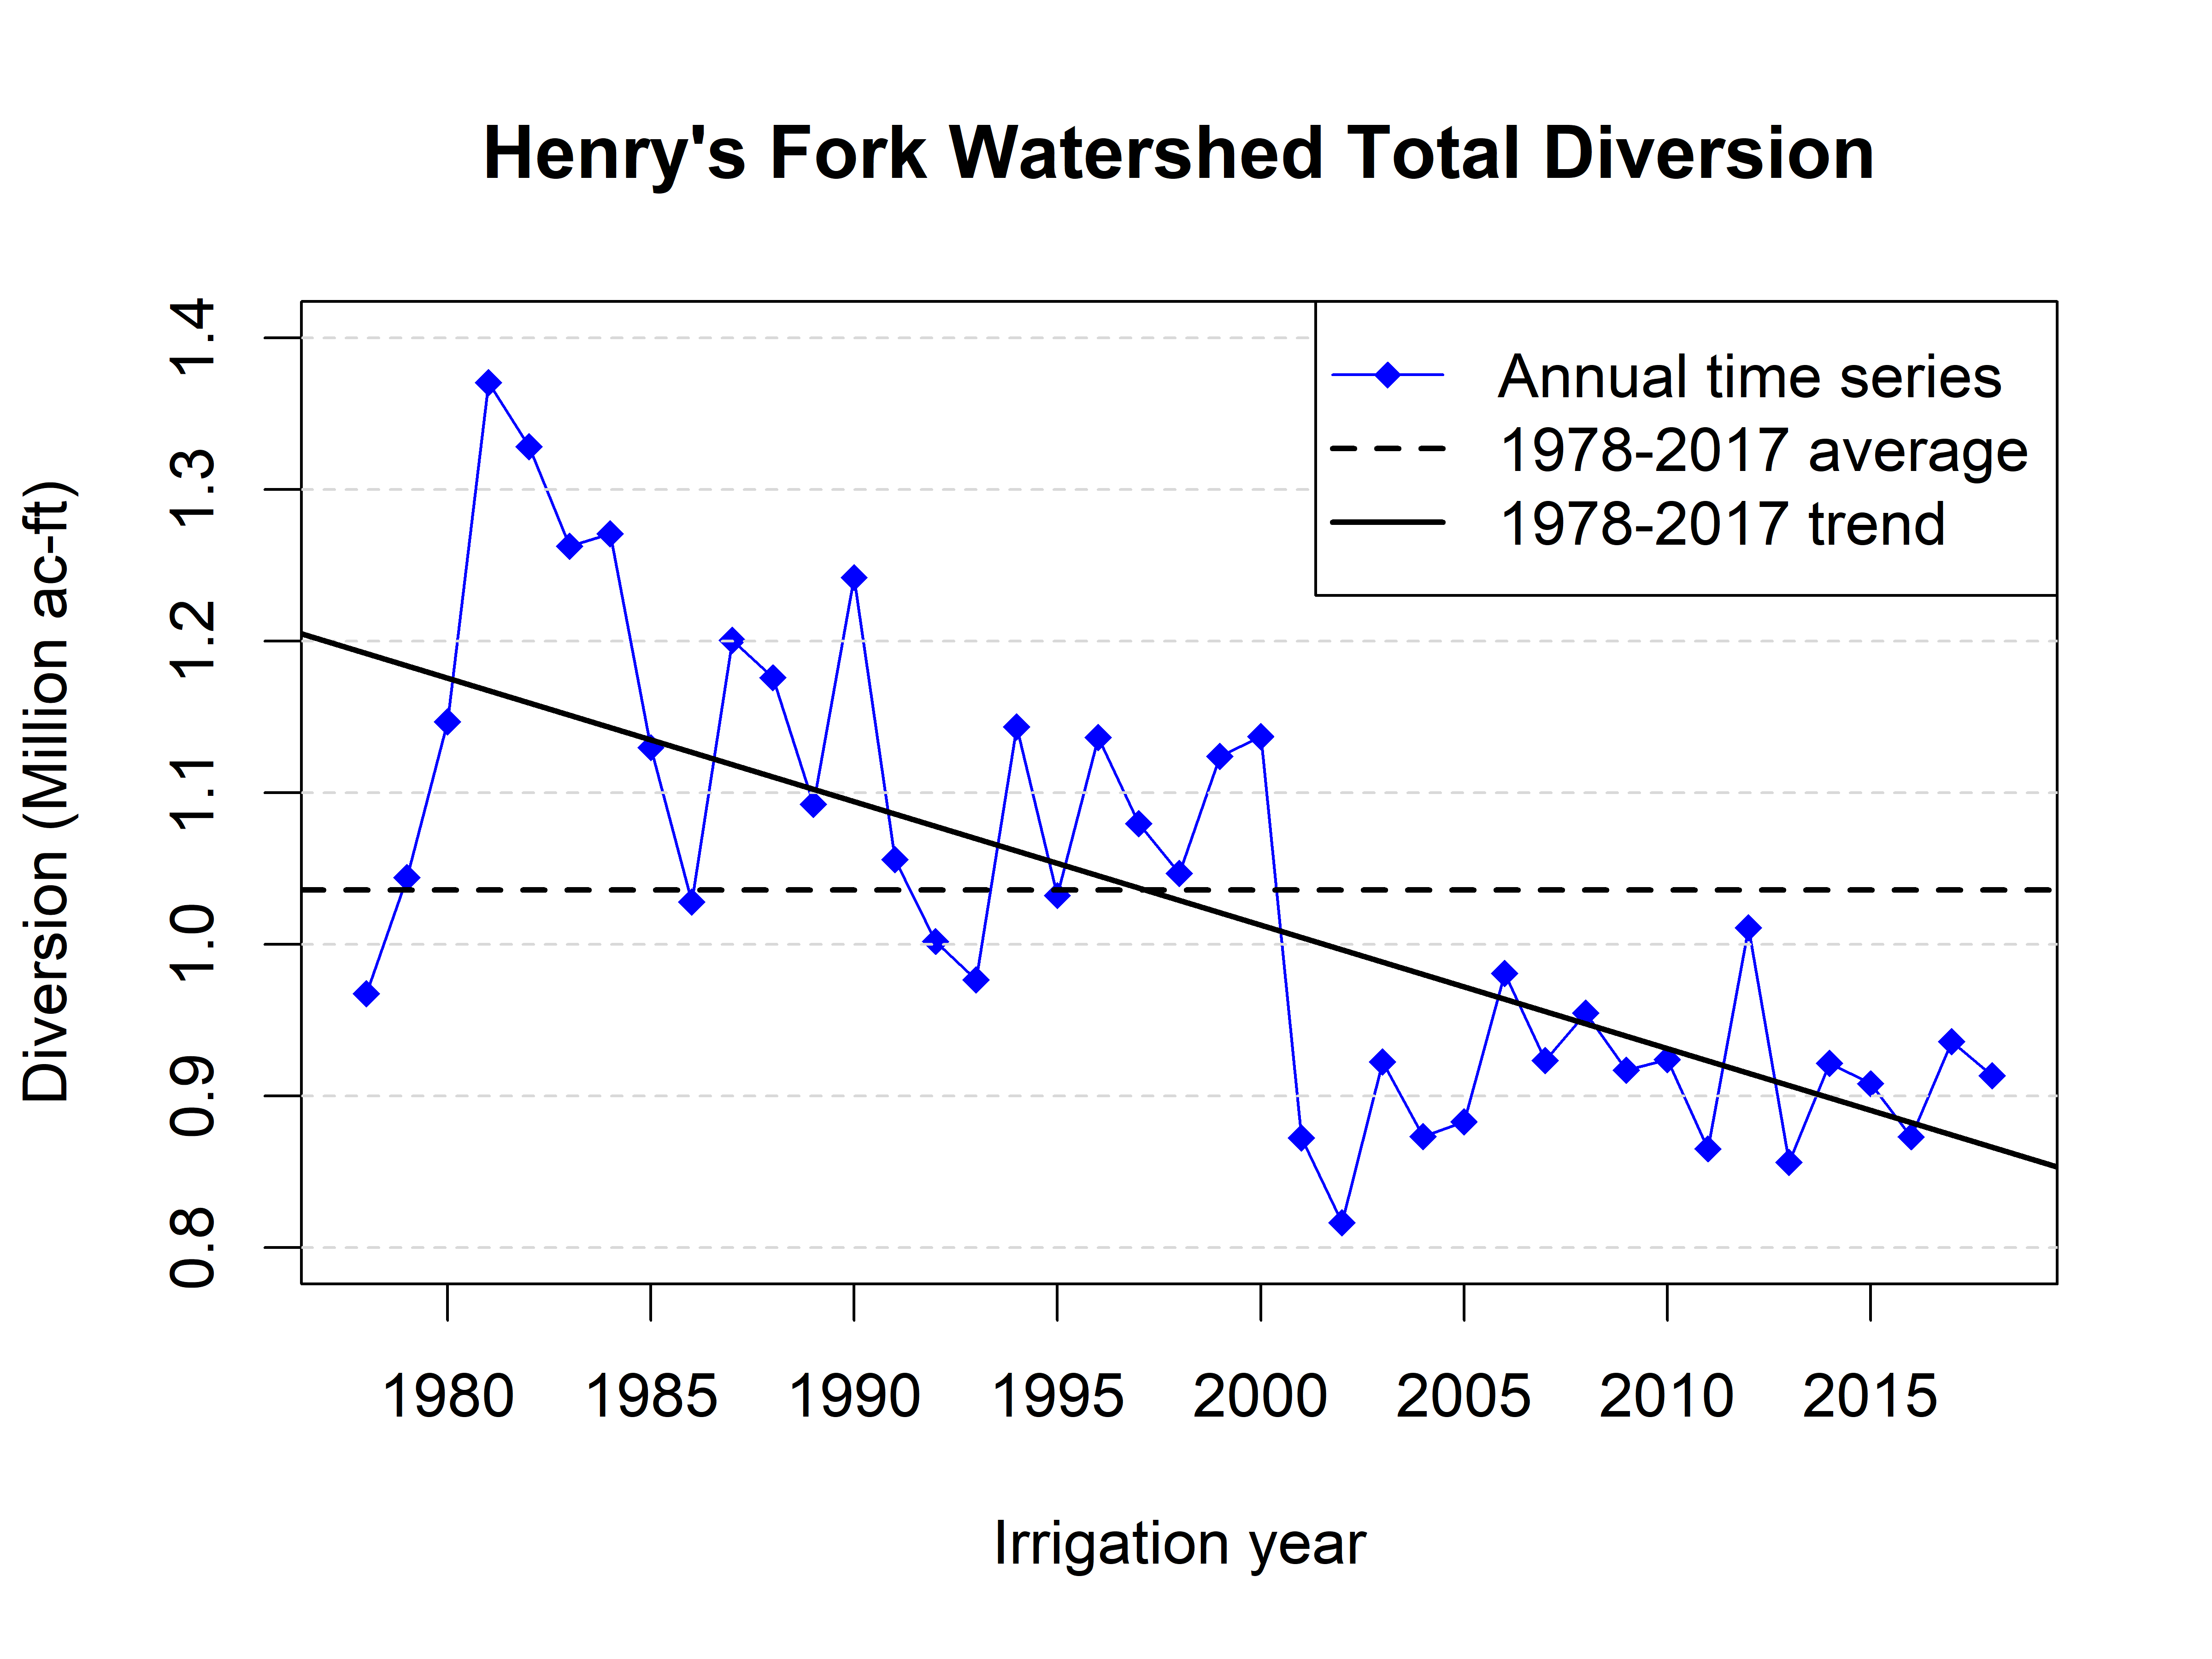
Diversion in irrigation year 2018 was lower than average but higher than expected based on the trend-adjusted average. To understand what I mean by this, look at the trend in watershed-wide diversion over the past 40 years. This trend is clearly decreasing, at a rate of around 9,000 ac-ft per year. This amounts to a net reduction in diversion of 360,000 ac-ft (30%) since the early 1980s.
Graph of total annual diversion in the Henry’s Fork watershed since 1978.
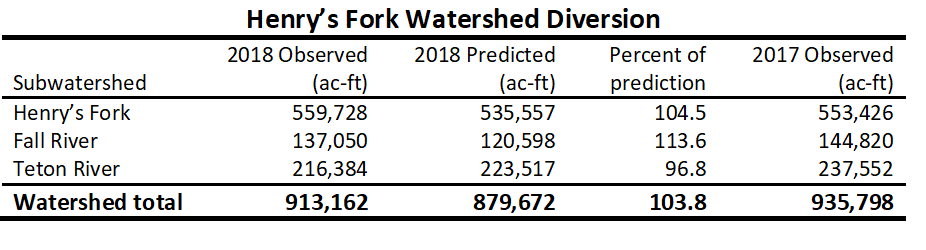
Mean annual diversion over the 1978-2017 period was 1.03 million ac-ft, but diversion has not exceeded that average since 2000. The primary reason for reduced diversion is increased irrigation efficiency, primarily use of sprinklers instead of surface application (flood and furrow irrigation). So, going into 2018, it was a certainty that diversion would be below the 40-year average, and this turned out to be the case. Total diversion in 2018 was 913,000 ac-ft, 11% below the average.
However, after adjusting for the long-term trend, year-to-year diversion varies depending on water supply. Diversion is generally higher during years of high water supply, which may seem counterintuitive, since one would expect diversion to be lower in wet years, under the assumption that less irrigation would be needed in those years. This is not the case for two reasons. First, under prior appropriation, water can be diverted only when a given water right is in priority. In years of high supply, junior water rights remain in priority longer into the summer, allowing junior users to divert more water than they would be entitled to in the dry years. Second, on streams with no large storage reservoirs, such as Fall River and the upper Teton River, diversion is limited by physical water supply. Once the river is out of water, no diversion is possible, even with administrative procedures that allow junior users in the Henry’s Fork watershed to rent storage water from Palisades Reservoir. So, you will see that relative to the trend, diversion was high in years of high water supply, including those in the early 1980s, mid- to late-1990s, 2011 and 2017. Diversion was low relative to the trend in dry years such as those in the early 1990s and early 2000s.
With regard to growing-season moisture availability, diversion can be higher in years with little summer precipitation, but water availability still largely determines diversion. For example, the summer of 2016 was drier even than the summer of 2018, yet diversion in 2018 was about 40,000 ac-ft greater than that in 2016 because there was a lot more water available in 2018 than in 2016. In addition, there was much water water leftover in 2018–realized both as increased streamflow and decreased reservoir delivery.
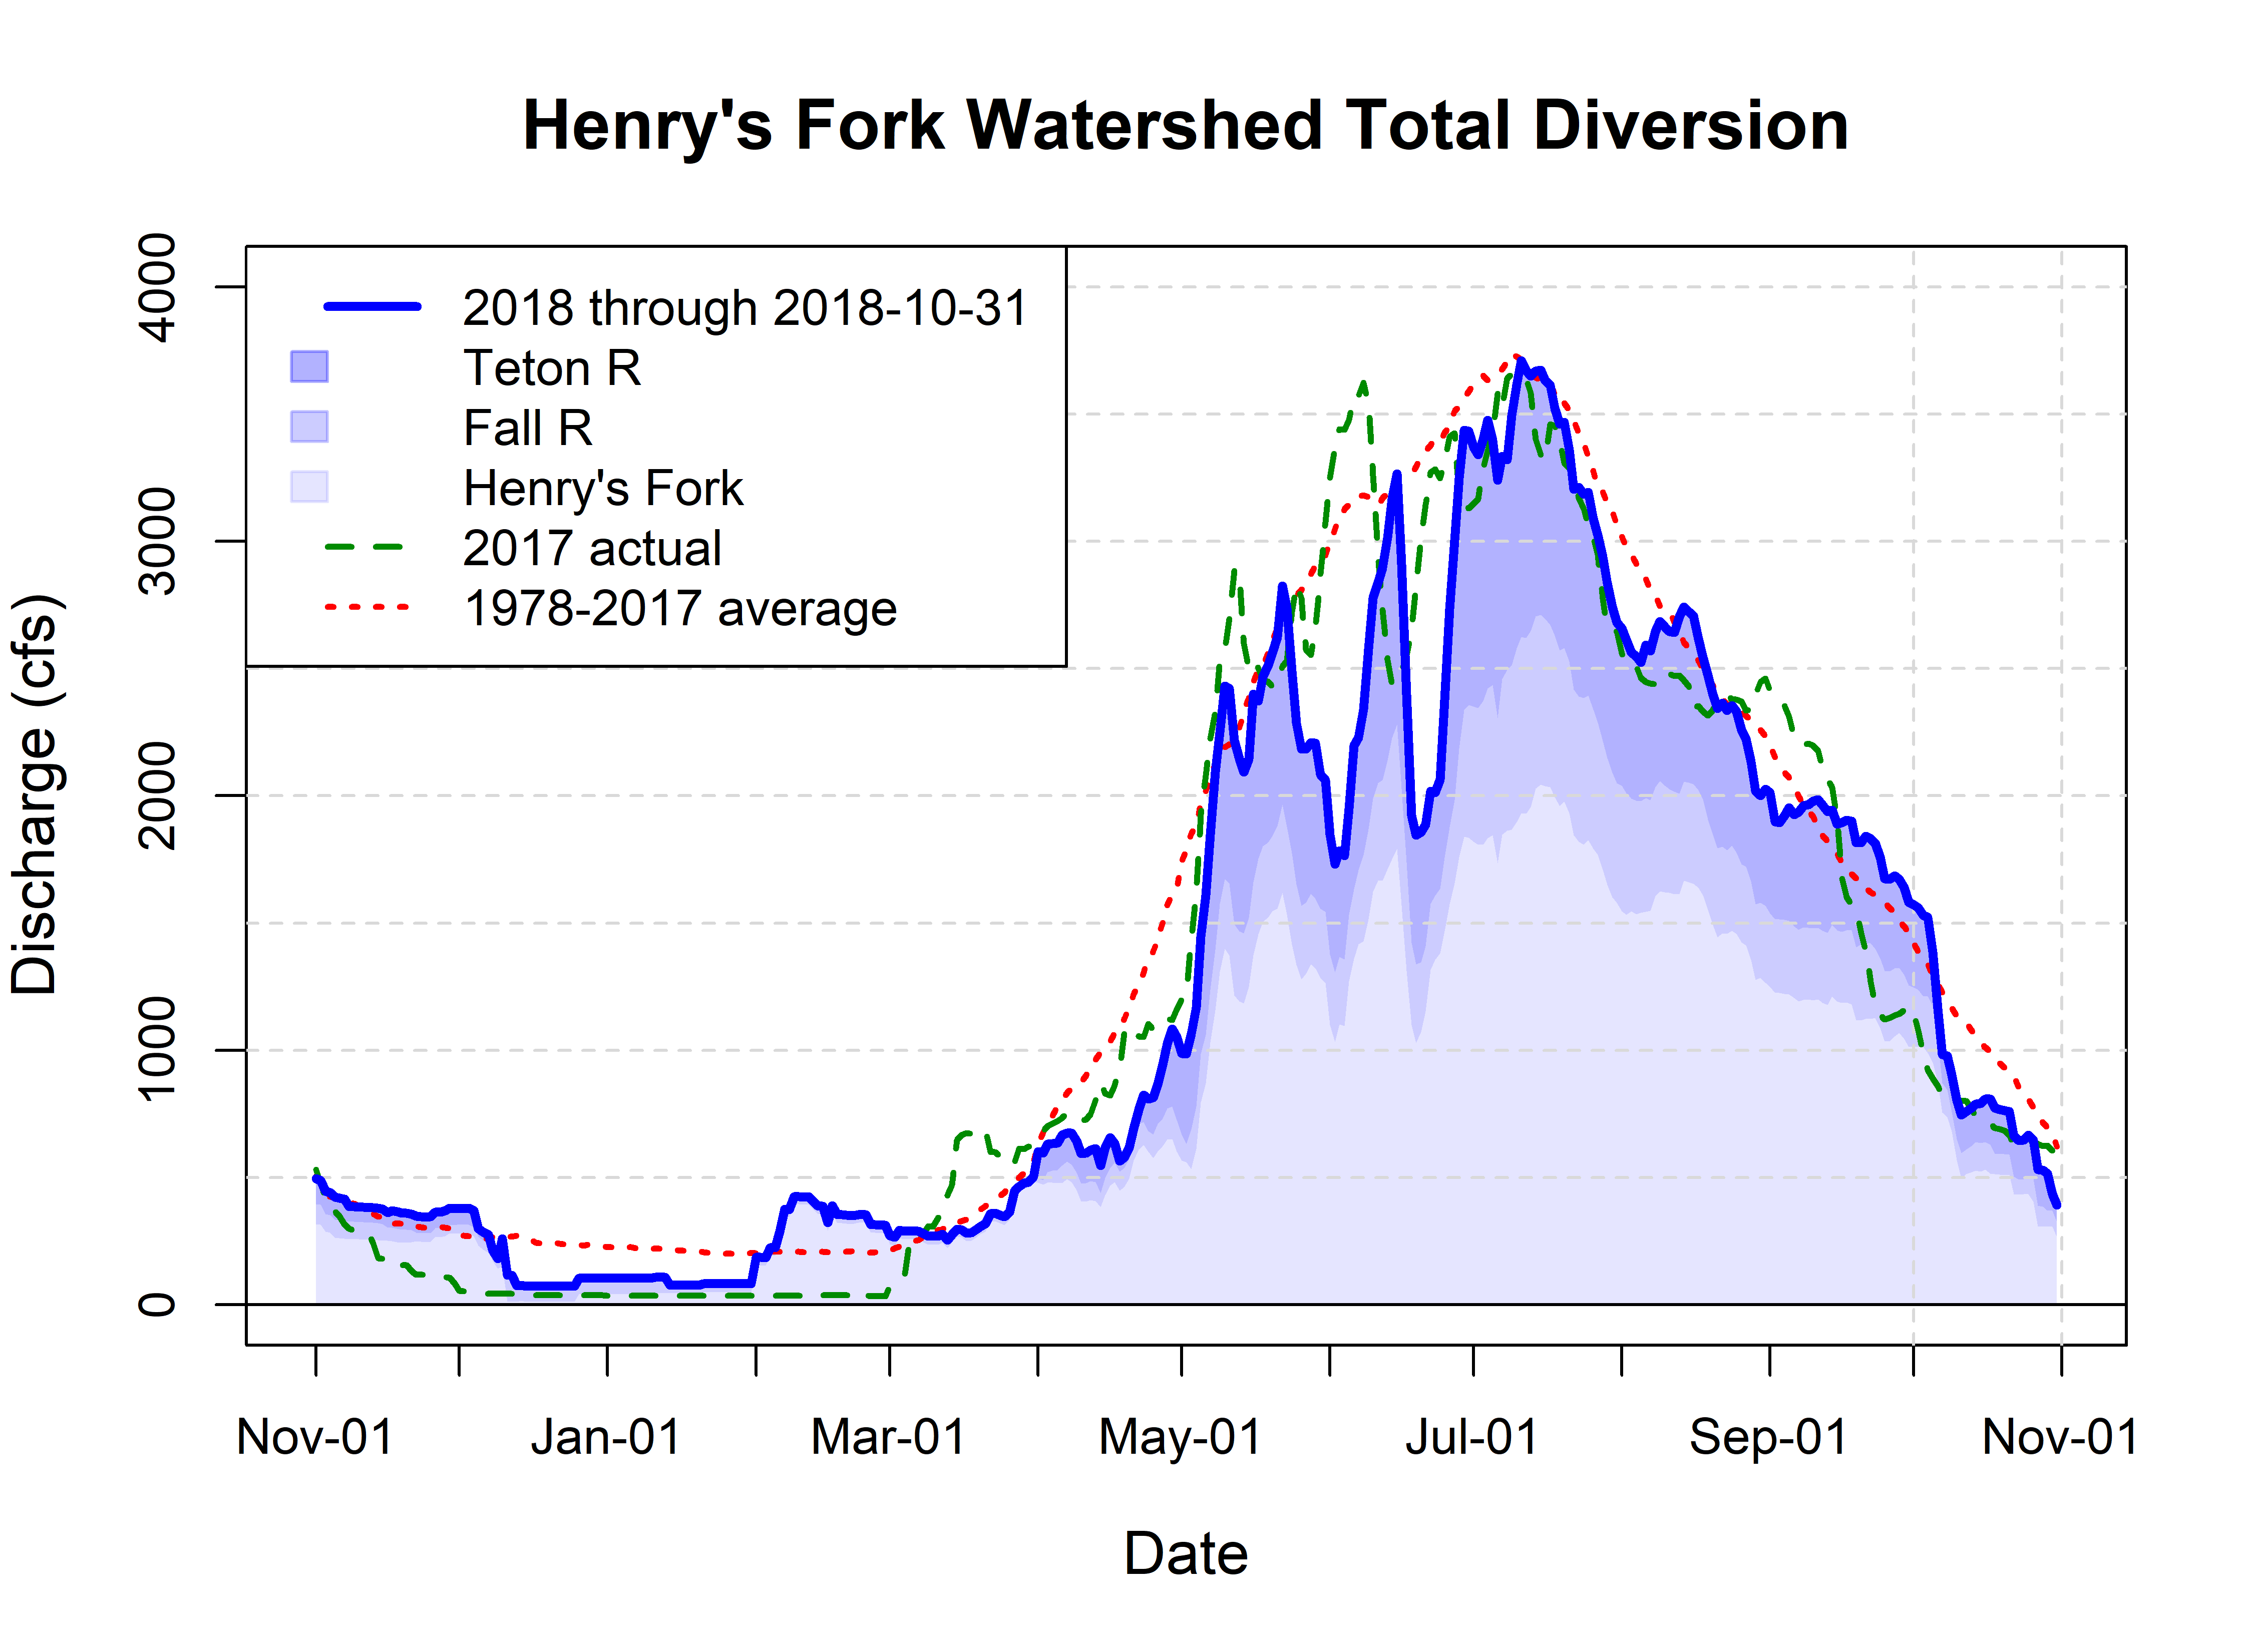
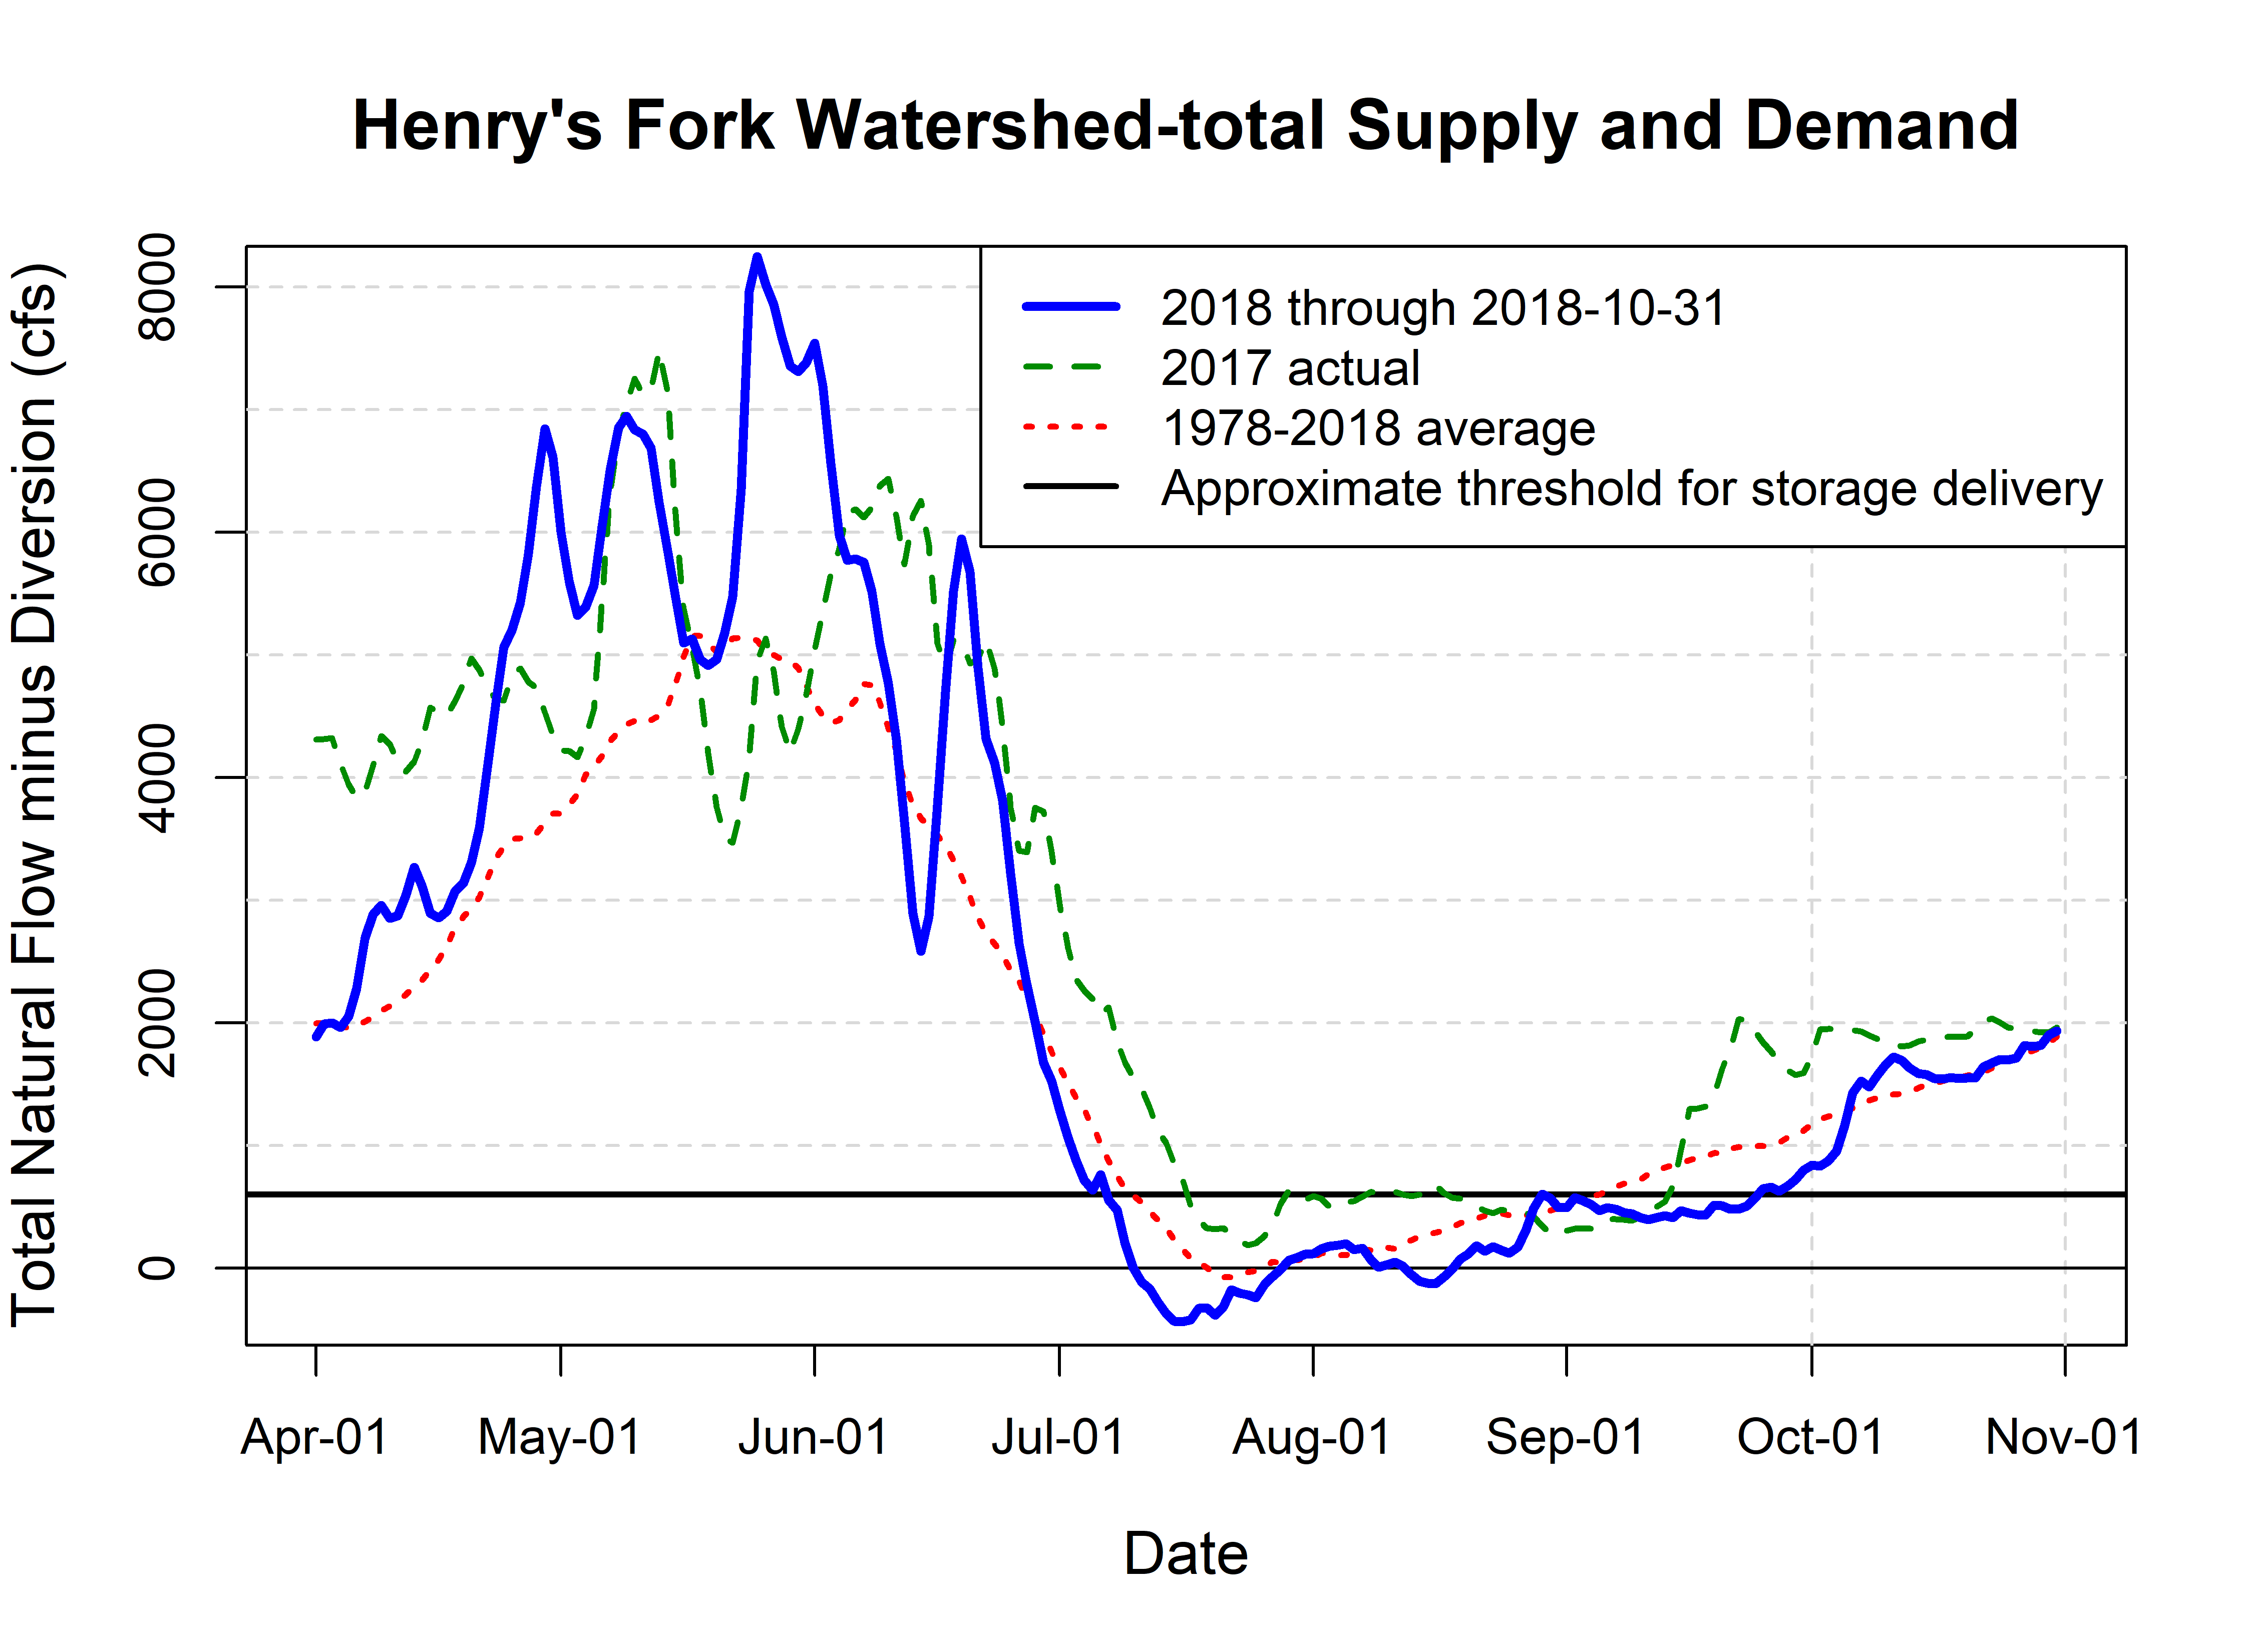
All of these factors considered, diversion in 2018 was a little higher than expected based on the long-term trend because water supply was good—slightly above average—and the summer was dry. Nonetheless, rain in May and June kept irrigation demand low during those months, resulting in total diversion around 100,000 ac-ft less than it would have been without the rain. All of this information is apparent from this year’s final diversion hydrograph and supply-demand curve. Supply minus demand was well above average most of April, May and June and slightly below average most of July through September. Between the first rain of the fall in mid-October and the end of the irrigation season, the supply-demand curve was right at average.
Diversion from Henry’s Fork, Fall River and Teton River during irrigation year 2018. Diversion between November 1 and March 31 is used for non-irrigation purposes such as managed aquifer recharge and livestock watering.
Graph of water supply minus demand during the 2018 irrigation season. When this difference falls below the “storage threshold” line, storage water must be released from some combination of Henry’s Lake, Island Park Reservoir, and Grassy Lake to meet demand.
Irrigation Efficiency: A good thing?
I’ll close this blog with one more observation that is counterintuitive to those unfamiliar with irrigation. This observation arises from the obvious question: if diversion from the river has declined by 30% since the late 1970s, why hasn’t that “saved” water contributed to higher streamflows and lower use of Island Park Reservoir? One part of this answer is that lower diversion does not mean lower consumptive use of water. More efficient irrigation produces more crop output per unit of land because irrigation can be more precisely applied across the whole field. This actually increases the amount of water actually consumed by irrigated crops. Research from around the world shows this to be nearly universal in irrigation systems. This concept has recently moved out of the technical scientific literature aimed at water geeks like me and into the mainstream, with an article in Science magazine. I borrowed the title of this blog from that article. Here is a link to the article: http://science.sciencemag.org/content/361/6404/748 This is required reading for anyone with an interest in water.
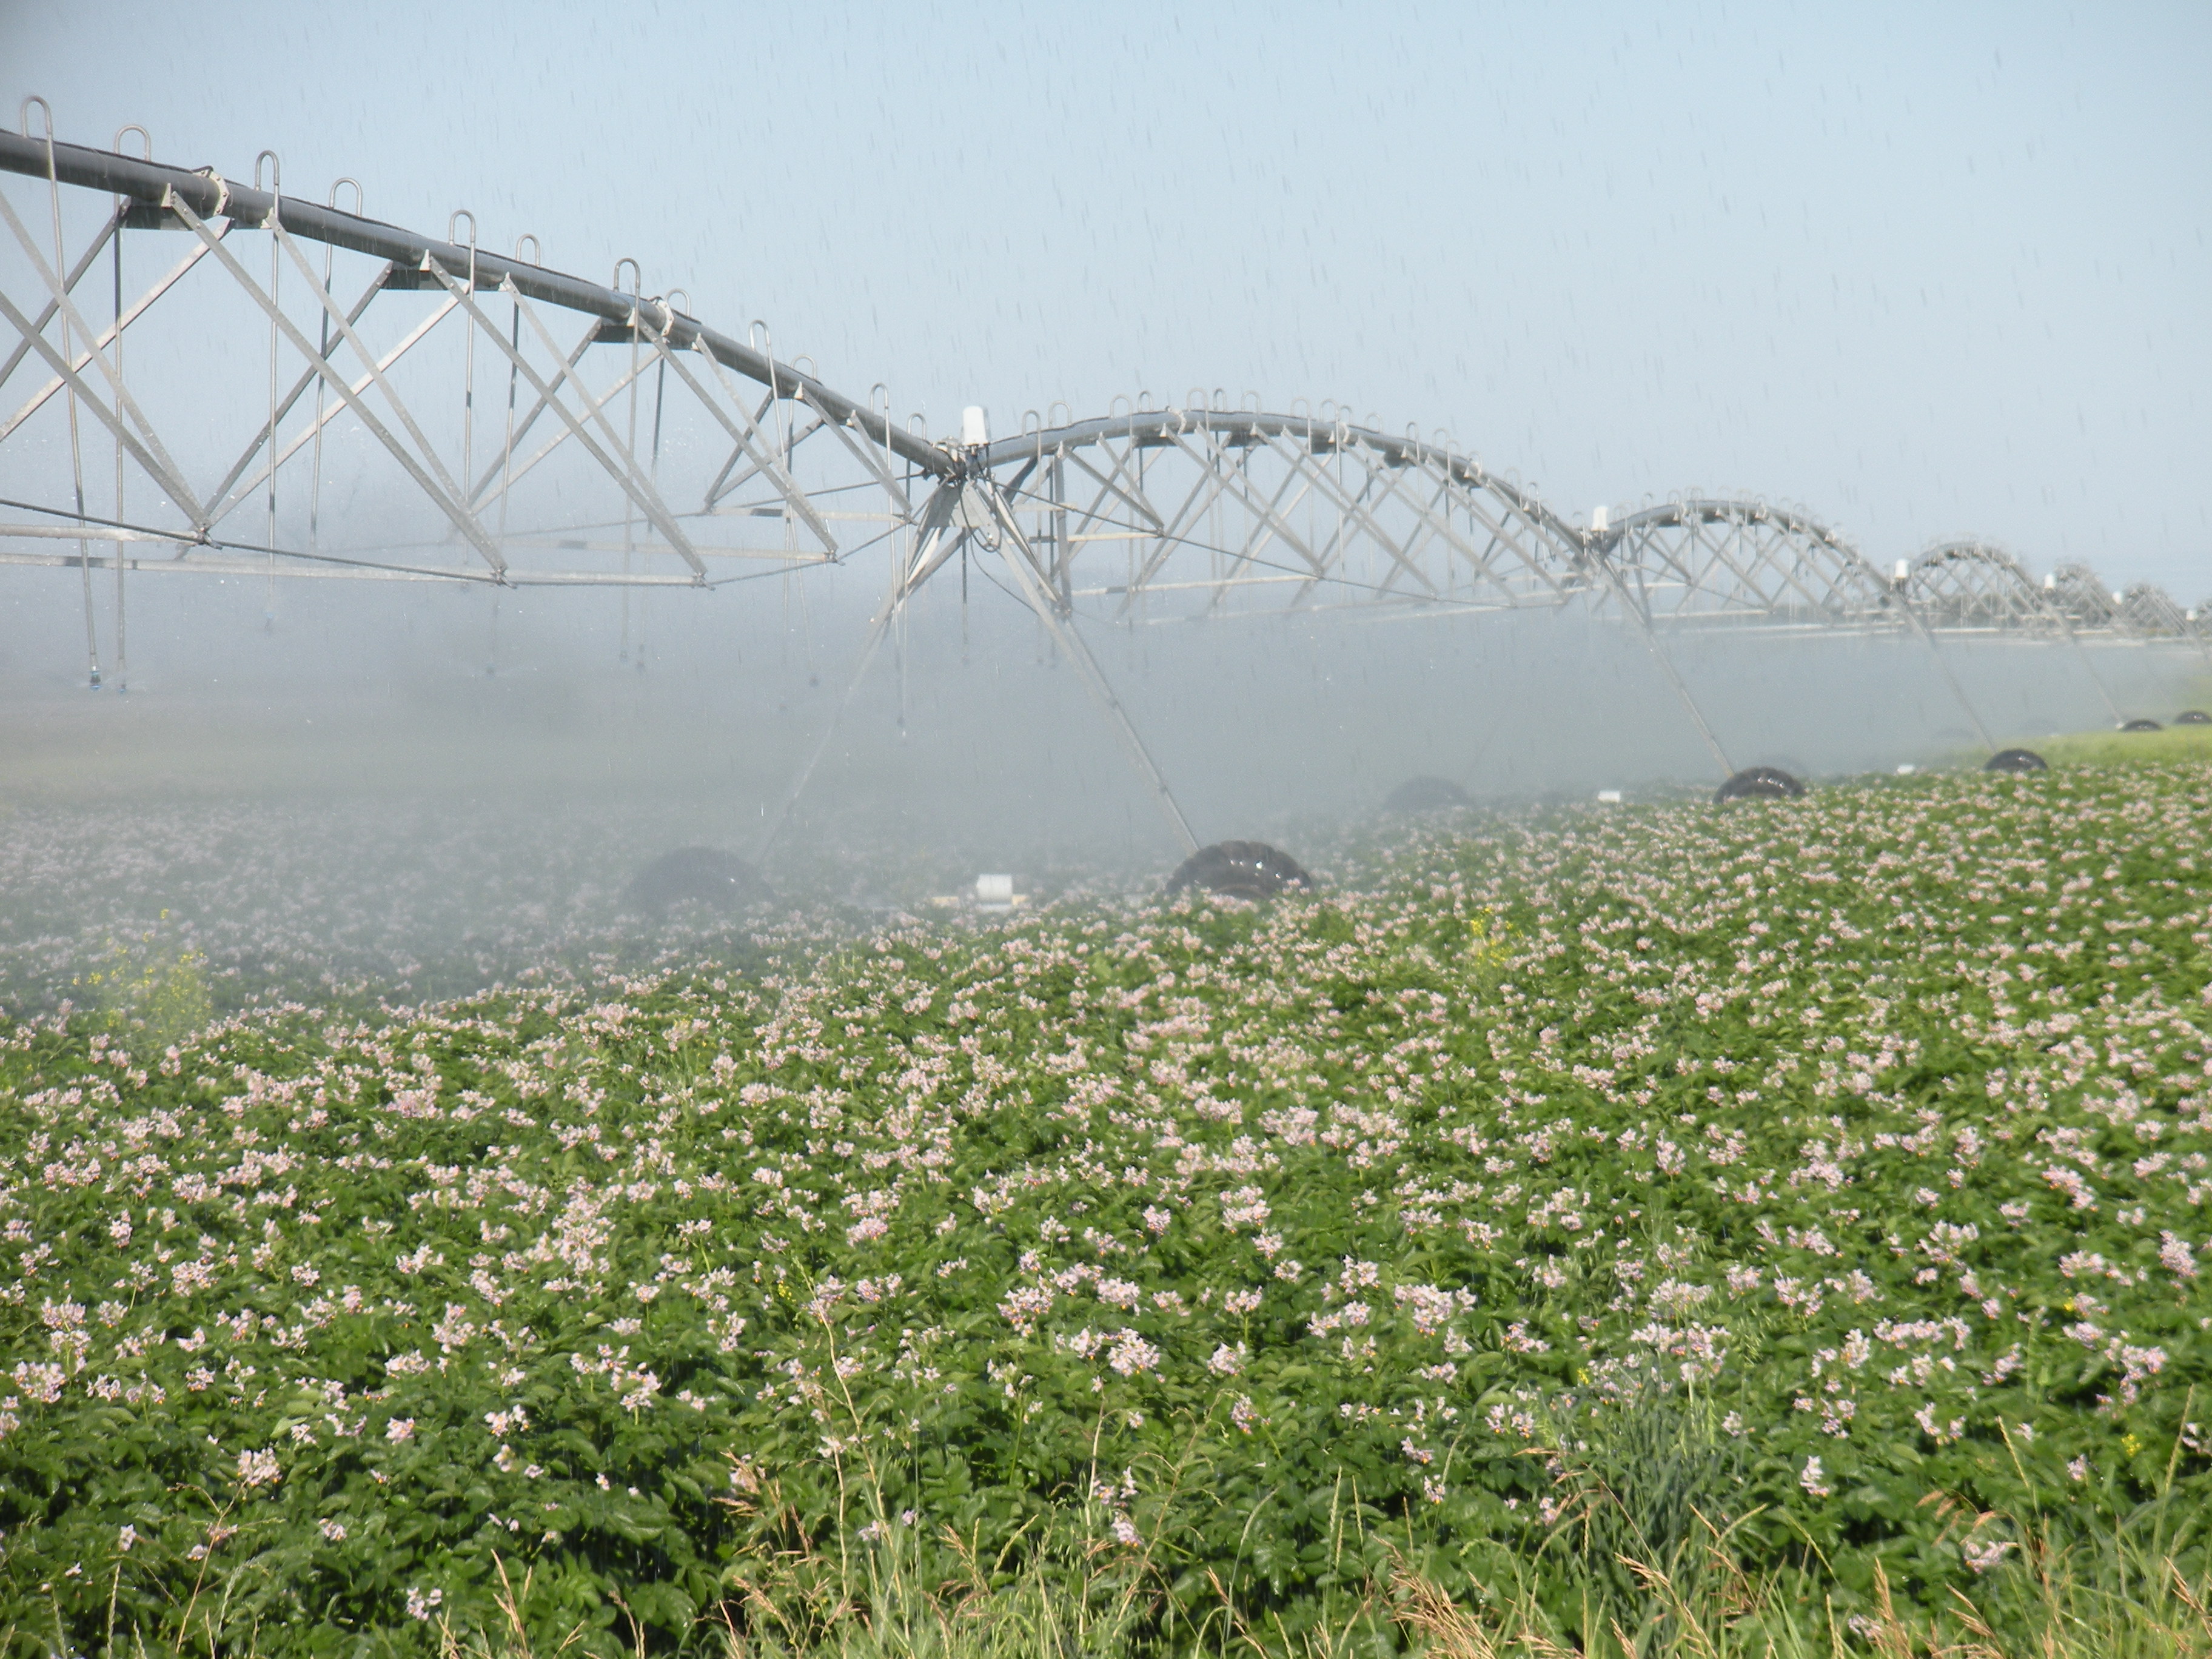
Sprinkler irrigation of a potato field near Ashton.
So, less diversion leads to more consumption, and the difference is realized as decreased return flows to the river from water withdrawn into canals but not used by crops. When combined with increased groundwater pumping over the past 60 years, the result is a lot less water returning to the river from groundwater during the summer. Because this occurs long after snow has melted and streams have receded, the only way to make up this water is to deliver more reservoir storage. For the first 80 years of extensive irrigation on the Snake River Plain, most of the surface water diverted from the river fed the aquifer, which provided a steady source of inflow to streams. Large amounts of water were withdrawn during spring runoff, prior to the time when crops needed very much. This allowed the aquifer to serve as a giant storage reservoir, storing water when it was available and slowly releasing it when it was not. Since then, aquifer storage has been steadily decreasing, which increases reliance on the surface reservoir system. That system holds a lot less water than the aquifer. This is why managed aquifer recharge has become an important component of water management in Idaho over the past few years.
Our Aquatic Ecology Program Manager, Dr. Jack McLaren, joined Idaho Falls city and FIPS-Mouche leadership at the opening ceremony parade along the Snake River Greenbelt to welcome competitors to the watershed and to make sure conservation was front and center.
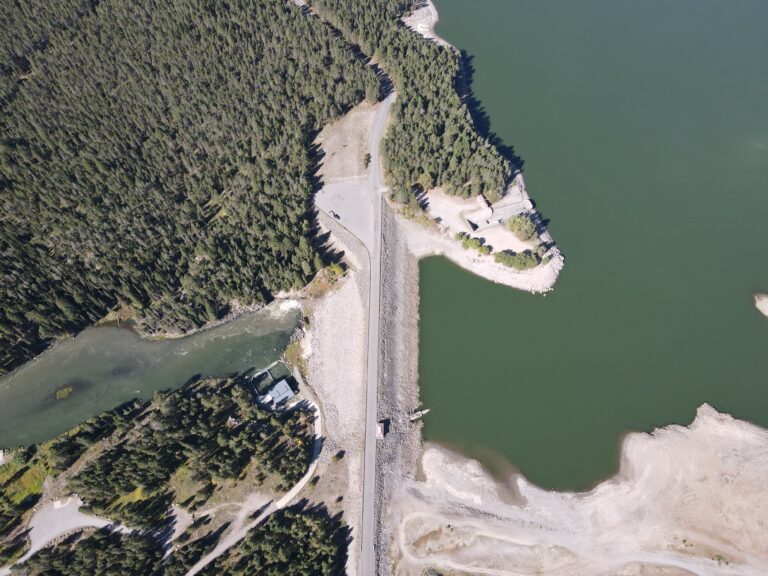
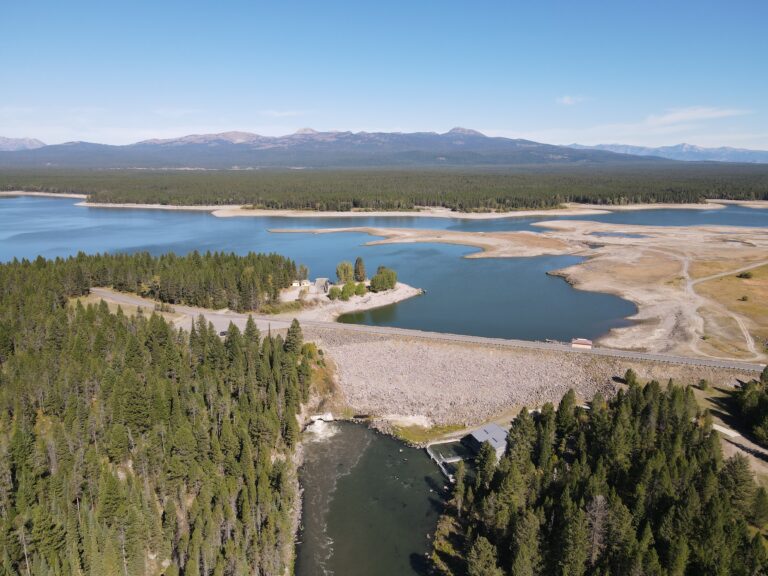
Drone photo of Island Park Dam taken on September 9, 2026 Looking Back on September September brought lows and highs to Island Park. Island Park Reservoir started September at 29% full and quickly fell to a low of 12% full on September 19. The rapid drawdown of the reservoir was the result of managers needing to move water downstream to American Falls (to irrigate farms in the Magic Valley with senior water rights). Such low
This story was written by Audrey Hunter (2026 intern) and was originally published in the Fall 2026 Newsletter. It’s no secret that late summers on Island Park Reservoir haven’t been in perfect conditions in recent years. Warm, turbid, algae-filled water plague reservoir recreationists while diminishing water quality downstream. Cyclical algal blooms decrease water clarity and create less-than-ideal circumstances for the reservoir’s flora and fauna. What’s the solution? HFF’s DIRTT Plan. In-Reservoir Oxygenation Nutrients released from
Drone photo taken on September 9, 2026 The Henry’s Fork Drought Management Planning Committee met on Wednesday, September 16 2026 to develop an updated reservoir management strategy. Downstream of the Henry’s Fork watershed, lower-valley irrigation demand over the rest of the season is anticipated to be slightly lower than projected last week, so Island Park Reservoir and Grassy Lake (in the Fall River drainage) do not need to deliver any more water out of the