What is HFF’s Daily Water Report?
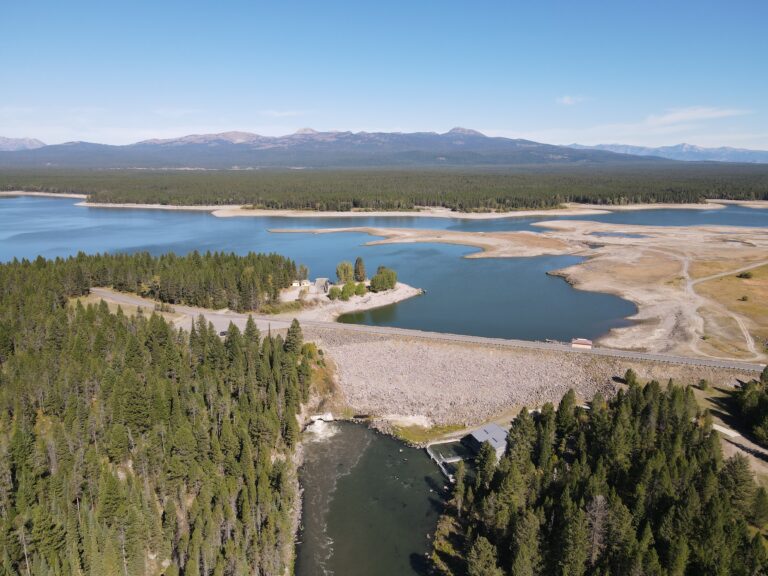
After the severe drought of 2016, which resulted in what is still the poorest water quality we have recorded in 11 years of monitoring at Island Park Dam—as well as the lowest reservoir drawdown since 2007—HFF started laying the scientific foundation for what we would eventually call “precision water management.” In its first seven years, that collaborative program has decreased drawdown of Island Park Reservoir by an average of 23,941 ac-ft and increased winter flow by an average of 100 cfs. See blog posts summarizing water year 2024 and the winter of 2025.
One of the centerpieces of the precision water management program is the daily water report, which I first issued to a small group of water managers and water users in early 2017. The daily email distribution list has grown to over 370 subscribers, which include water users, water managers, anglers, fishing outfitters and guides, local journalists, scientists, nonprofit colleagues, weather enthusiasts and others.
What goes into the report?
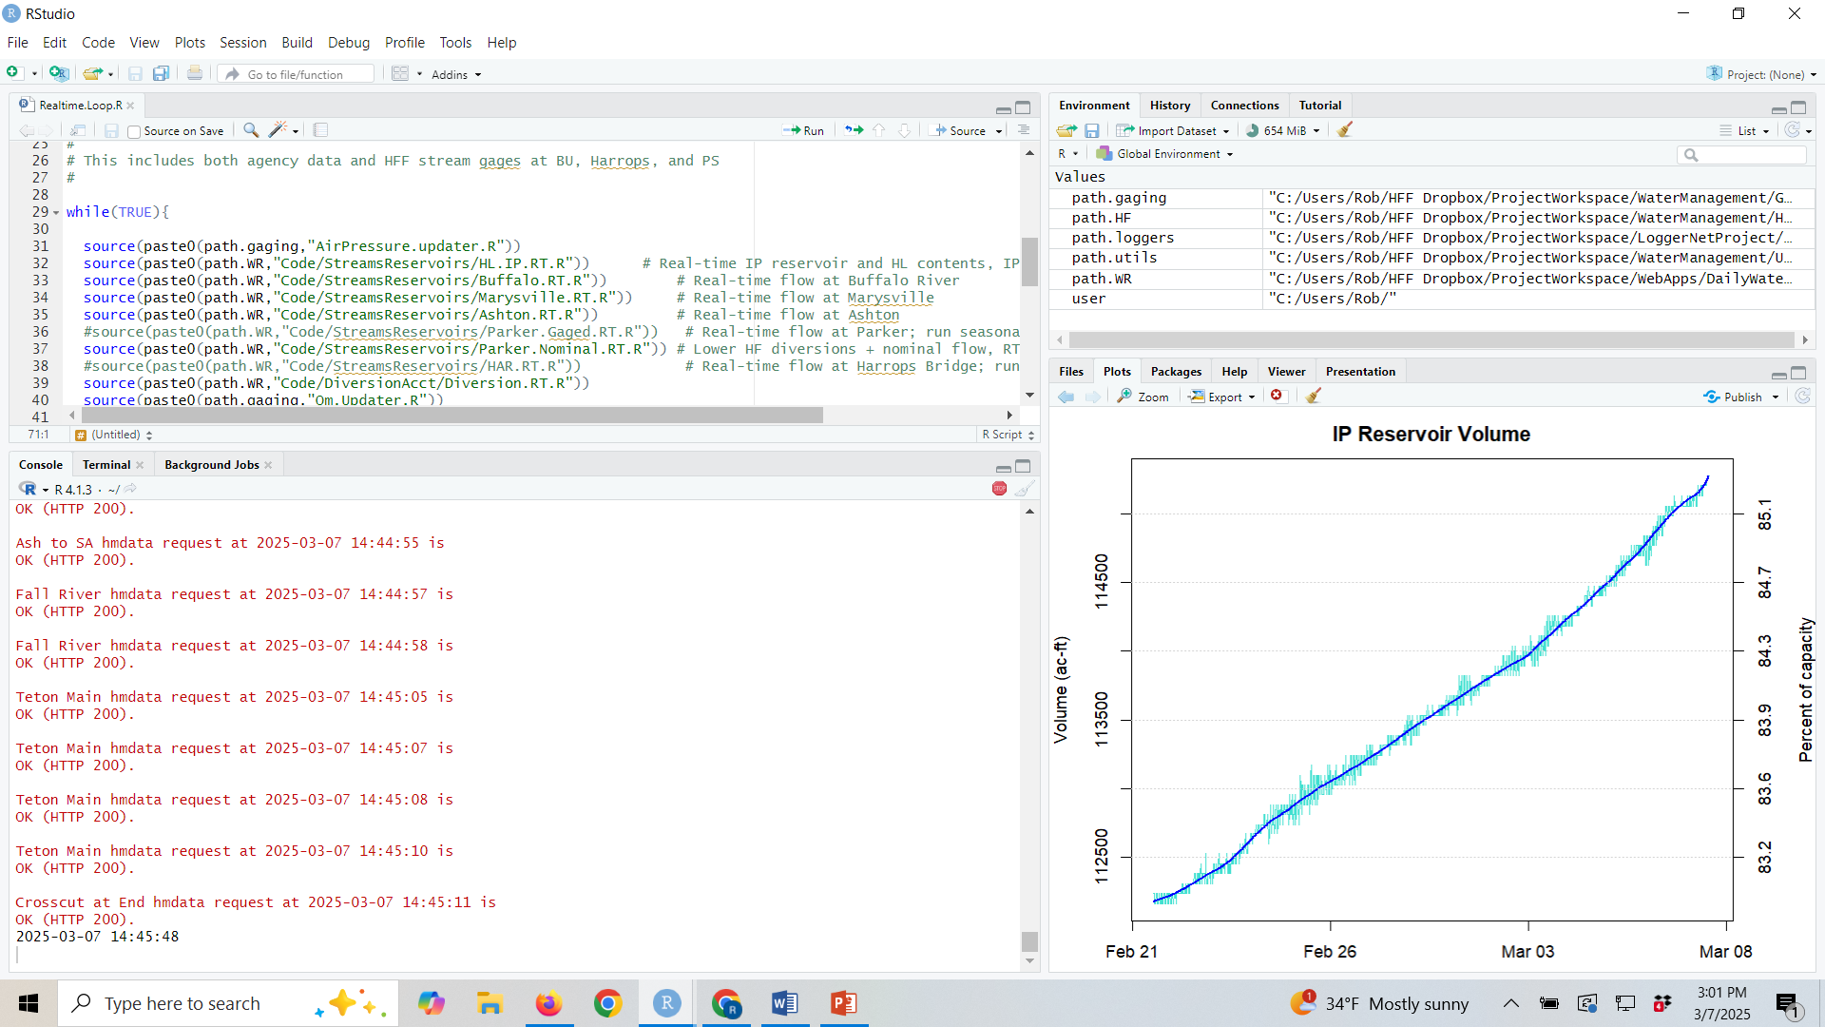
Every day, we run a set of computer code that automatically downloads and compiles around 220 pieces of daily climate and water data from a variety of sources, including our own stream gages. In the summer, we download and compile an additional 60+ data points from HFF’s water-quality network. Many of the daily data values come to us as 15-minute observations, meaning that 96 individual observations are summarized to produce a single daily value. No matter how you count it, we automatically download and process many thousands of data points each day, amounting to millions each year. While HFF staff have written every one of the thousands of lines of computer code that do this, we are greatly reliant on state and federal agencies that collect most of that data and make it available for free to anyone who has an internet connection.
Here are the primary sources of that data, including links to the agency websites and portals. Full disclosure—our computer code primarily uses backdoor pathways provided specifically for automated download by the agencies, although we do access some of the data directly through internet address strings that can be built and accessed through the links below.
- US Bureau of Reclamation Pacific Northwest Agricultural Weather Network (AgriMet)
- US Bureau of Reclamation Pacific Northwest Hydrological and Meteorological Network (HydroMet)
- US Department of Agriculture Natural Resources Conservation Service snow products
- US Geological Survey National Water Information System (NWIS)
- Idaho Department of Water Resources (IDWR) water rights accounting database
In addition to numerical data that form the core of the water report, we also rely on a variety of weather and climate products, most provided by the National Oceanic and Atmospheric Administration (NOAA). We also rely heavily on the U.S. Drought Monitor, a collaborative project of the University of Nebraska and several federal agencies. Real-time data from local weather stations, including HFF’s, are also used to downscale these broader-scale products to provide accurate watershed-specific forecasts.
What comes out of the report?
The 220 pieces of raw daily water and climate data generate well over 400 pieces of daily output that range from simple measures such as the mean daily streamflow at Island Park Dam to complex drought indicators such as the one-year accumulated difference between precipitation and evapotranspiration. Whether you just missed today’s report or aren’t on the email list, you can access, view and download all of this information at the online version of the water report and at HFF’s water quantity dashboard. From either of those locations, you can access the rest of HFF’s online data websites and modeling tools.
The content and narrative text of the water report varies from season to season and across days of the week. If you are a long-time reader, you know the drill. If not, here’s a brief guide to daily and seasonal content.
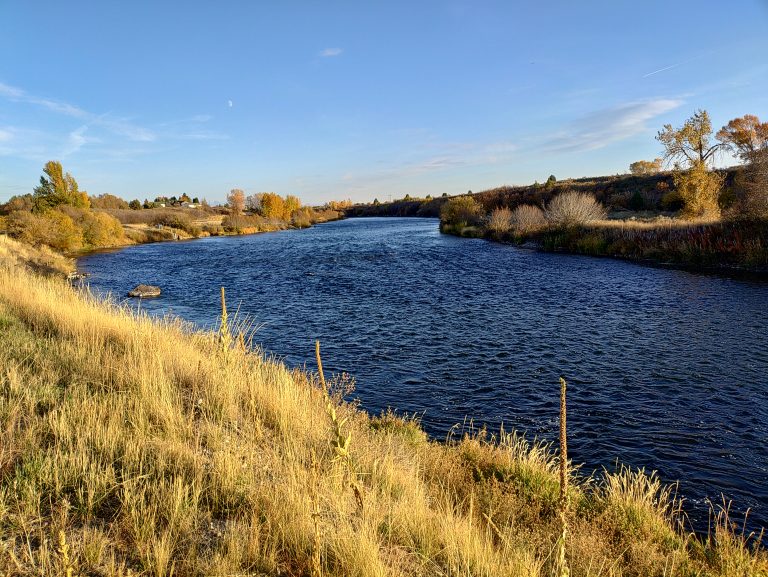
Autumn (October–November)
- Summaries of previous water and irrigation years
- Natural streamflow as an indicator of base flow conditions after the summer
- Fall fill of Island Park Reservoir
- Temperature and precipitation
Winter (December–February)
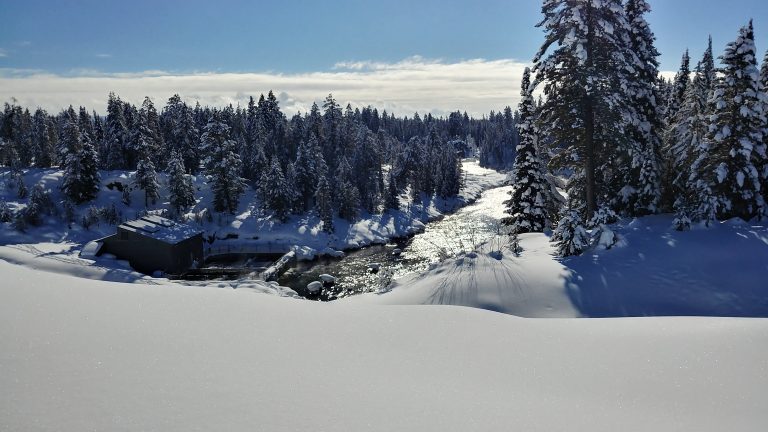
- Winter outflow from Island Park Reservoir
- Snow water equivalent (SWE) accumulation
- Temperature
Spring (March–May)
- Peak SWE accumulation and beginning of snowmelt
- Reservoir ice-off and fill
- System-wide reservoir operations
- Managed aquifer recharge opportunity (if any)
- Early-season diversion
- Predictions of summer water supply and water-quality conditions

Summer (June–September)
- Irrigation management, including lower-watershed streamflow targets
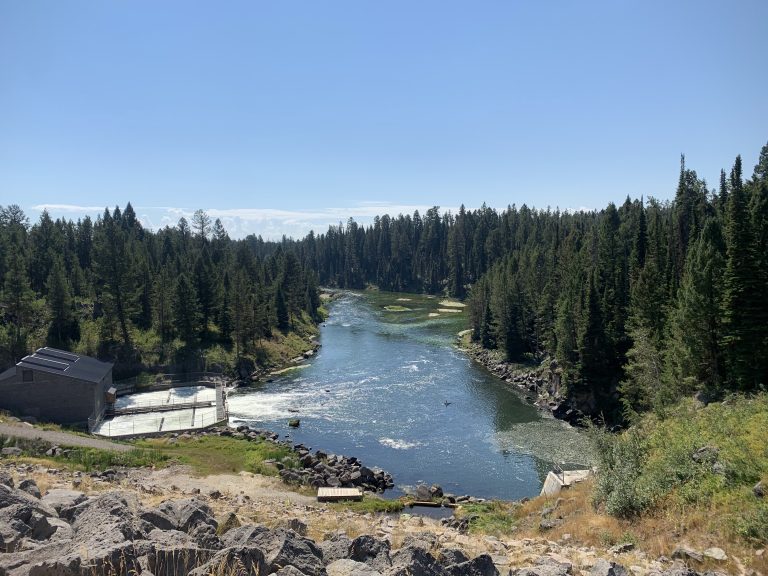
- Island Park Reservoir outflow and draft
- System-wide reservoir system management
- Water-rights priorities and other accounting features
- Natural streamflow
- Water quality
Daily emphasis
- Last/first of the month: last month’s climate summary and new monthly outlooks
- Monday: weekly climate summary and notable changes over the weekend
- Tuesday: Diversion and water-rights accounting (summer only)
- Wednesday: Teton River streamflow
- Thursday: Drought status update and new long-term outlooks on 3rd Thursday; Fall River and lower Henry’s Fork
- Friday: Outlook for the weekend; storage reservoir summary, upper Henry’s Fork
More Information
Download the full water report data guide and disclaimer here.