When I began my internship at the Henry’s Fork Foundation (HFF), I knew I’d be working with data, but I didn’t realize how deep those waters would go. Over the summer, I’ve had the chance to build, expand, and refine some of the core data tools HFF uses to understand the Henry’s Fork and the larger Snake River system.
I know not everyone reading this is a data nerd like me, but I’d love to give you a glimpse of the work I did. I promise to keep it clear, even if some of the details sound technical!
One of my first projects was updating and expanding HFF’s real-time water quantity app. This tool takes data from stream gages and reservoirs and makes it available online for the public, anglers, and water managers. When I arrived, the app mostly focused on Henry’s Fork. My work expanded its reach to include the South Fork of the Snake River and the Snake River headwaters. This meant writing scripts to automatically pull in new data sources, clean them, and link them to the app’s database. It may not sound glamorous, but it means more people can see, in real-time, how water is moving across the basin. And for a watershed where timing and quantity are everything, that kind of access is powerful.
A snippet of what expanded watershed on the web app would look like.
After the real-time work, I shifted to a much deeper task: building what I started calling my “scratch reader” — a daily climate data reader that pulls together records from dozens of stations, some going back to 1971.
This was harder than it sounds. Many of the datasets had issues:
– Negative daily precipitation (DP) values that needed to be corrected.
– Mismatched precipitation and temperature data across stations.
– Missing stretches of climate data that had to be estimated from nearby stations.
An example of fixing one of these issues was, I wrote scripts that:
– Checked for missing or impossible values,
– Paired stations together based on correlations (using SNOTEL and other sources), and
– Filled gaps using linear regression models, cascading through first-, second-, and third-choice reference stations.
By the end, I had created a complete, bias-corrected dataset covering over 40 stations, stretching from the 1970s to the present. This work will hopefully now feed into HFF’s daily water report models — making them stronger, more reliable, and more reflective of long-term climate.
Some of my other detailed work involved temperature and evapotranspiration (ET) data, and a lot of time was spent correcting and filling in missing records.
For example: Developed methods with my mentor to fill precipitation (AP/DP) values year by year, sometimes reaching back to 1989–2006 for stations like Grand Targhee.
It might sound like a tangle of scripts and CSV files (and sometimes it felt that way), but the outcome was simple: turning incomplete, messy climate histories into usable, trustworthy records.
The Henry’s Fork Foundation has long relied on data to guide water management and conservation. The work I did this summer ensures that the models HFF runs each day are backed by decades of climate history — not just today’s conditions. That means better forecasts, more informed management, and a stronger foundation for science-driven decisions in the watershed.
For me, it also showed how much persistence data science takes. Debugging, checking correlations, re-running models — it’s a lot like wading through a river. You have to keep moving, even when the current pushes back.
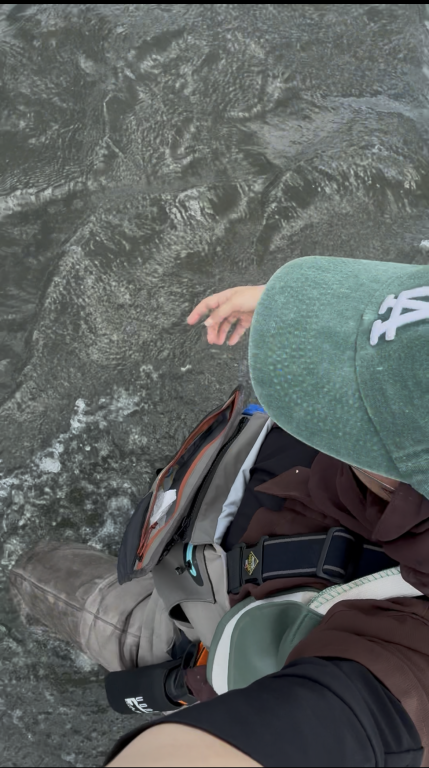
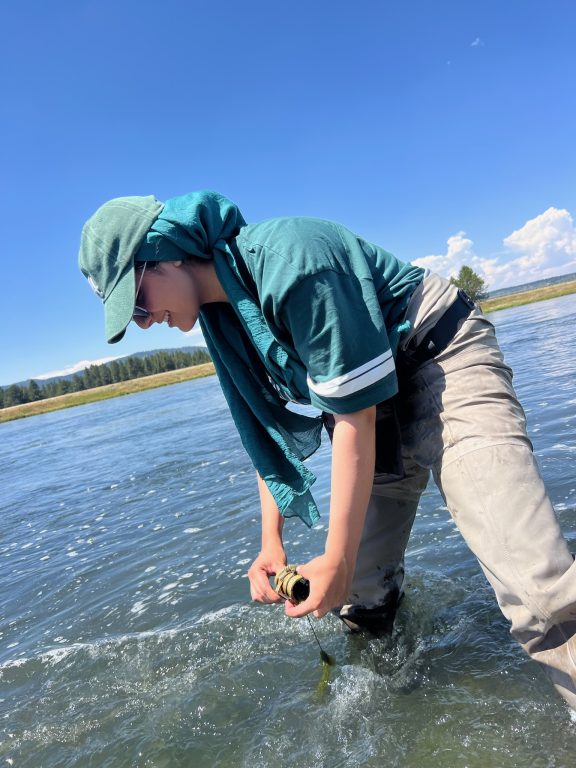
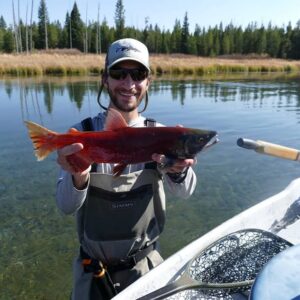
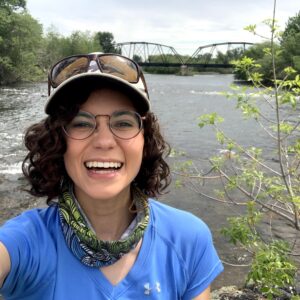
Can’t forget my first wading experience!Collecting data from the logger.
Of course, this internship wasn’t only about code. The people I worked with, my fellow interns, HFF staff, and especially Dr. Rob Van Kirk, made this experience incredibly meaningful.
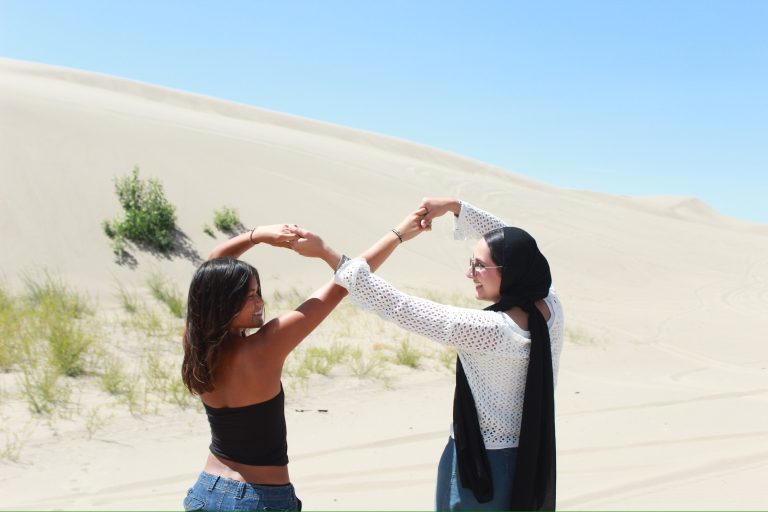
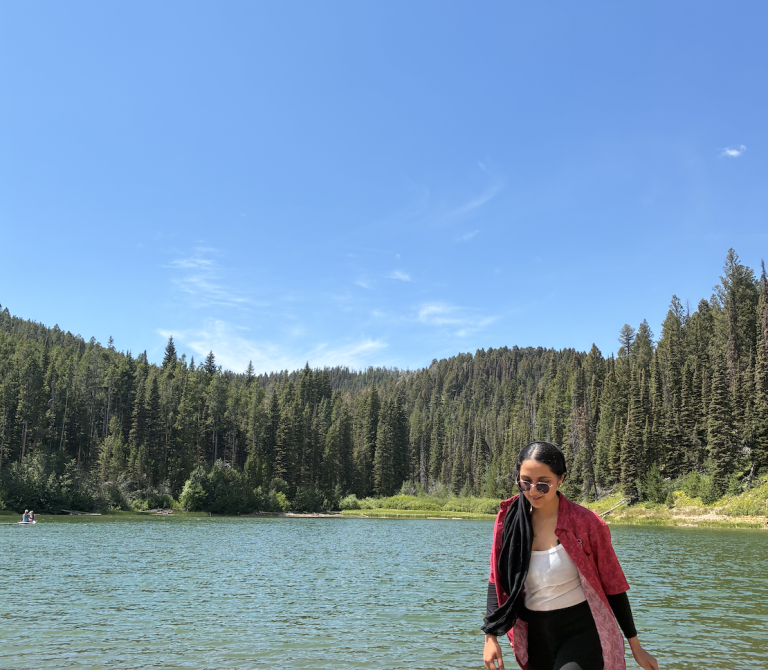
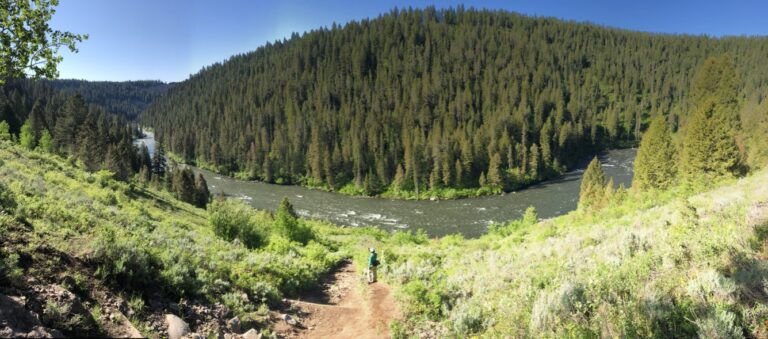
As the summer went on, one by one the other interns finished their projects and headed home. I’m wrapping up a week later, with the intern suite strangely quiet. Saying goodbye wasn’t easy, especially after all the shared adventures, from hiking Packsaddle Lake to sandboarding at the St. Anthony dunes.
It’s bittersweet to leave both the friends I made and the Idaho waters I’ve come to love. But just like the datasets I worked on, I feel like these experiences will stay with me long after the gaps are filled.
Our Aquatic Ecology Program Manager, Dr. Jack McLaren, joined Idaho Falls city and FIPS-Mouche leadership at the opening ceremony parade along the Snake River Greenbelt to welcome competitors to the watershed and to make sure conservation was front and center.
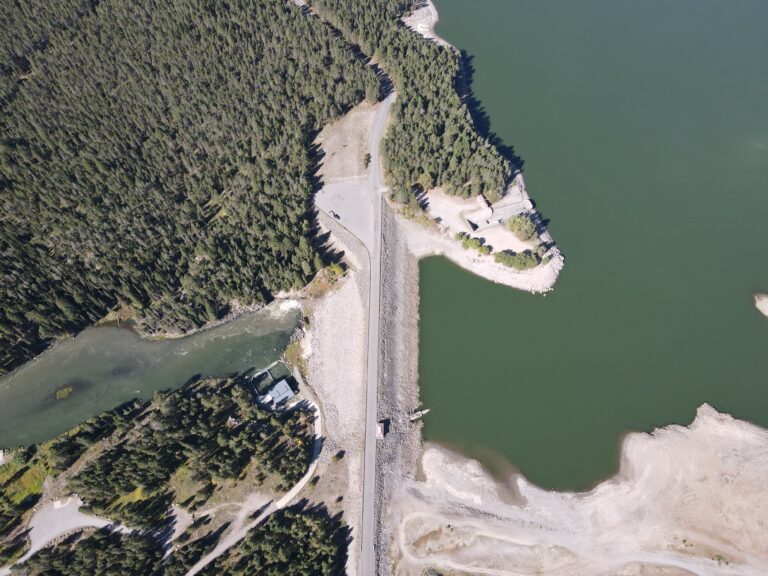
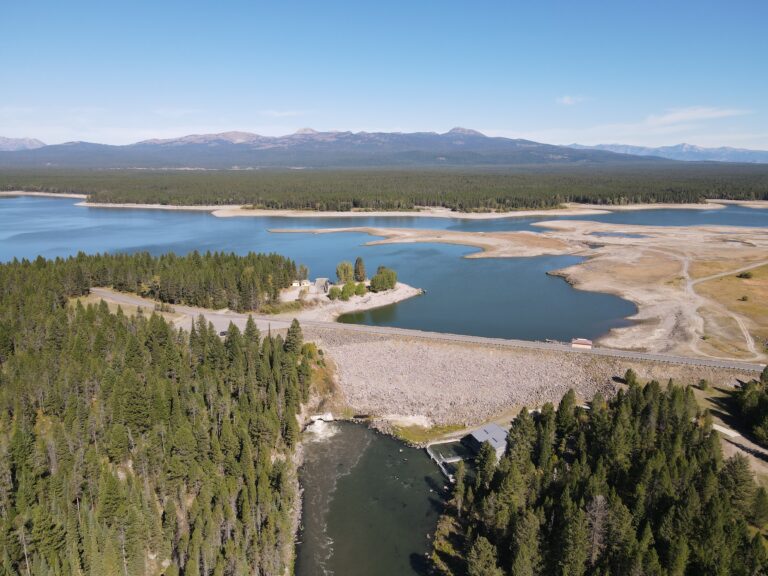
Drone photo of Island Park Dam taken on September 9, 2026 Looking Back on September September brought lows and highs to Island Park. Island Park Reservoir started September at 29% full and quickly fell to a low of 12% full on September 19. The rapid drawdown of the reservoir was the result of managers needing to move water downstream to American Falls (to irrigate farms in the Magic Valley with senior water rights). Such low
This story was written by Audrey Hunter (2026 intern) and was originally published in the Fall 2026 Newsletter. It’s no secret that late summers on Island Park Reservoir haven’t been in perfect conditions in recent years. Warm, turbid, algae-filled water plague reservoir recreationists while diminishing water quality downstream. Cyclical algal blooms decrease water clarity and create less-than-ideal circumstances for the reservoir’s flora and fauna. What’s the solution? HFF’s DIRTT Plan. In-Reservoir Oxygenation Nutrients released from
Drone photo taken on September 9, 2026 The Henry’s Fork Drought Management Planning Committee met on Wednesday, September 16 2026 to develop an updated reservoir management strategy. Downstream of the Henry’s Fork watershed, lower-valley irrigation demand over the rest of the season is anticipated to be slightly lower than projected last week, so Island Park Reservoir and Grassy Lake (in the Fall River drainage) do not need to deliver any more water out of the