In 2018, the Henry’s Fork Foundation began its Precision Management program. The motto for this program is “every drop, every day, everywhere.” Record-breaking droughts experienced in the Henry’s Fork in 2015 and 2016 emphasized the need to precisely manage every drop of water, every day, everywhere within the Henry’s Fork watershed for the benefit of both farms and fish. This program included installing automated headgates on canals and required HFF to embark on a new-to-us journey: measuring streamflow.
Why measure streamflow?
Plants. Streamflow is largely reported via streamflow gages. These gages sit in the water and measure river depth. Each location has its own relationship between river depth (also known as stage) and streamflow. This relationship is known as a rating curve. So the gage measures river depth, reports that to an internet server, the server converts that depth to a streamflow based on the rating curve, and reports that online for users all over the world to see. But sometimes that relationship changes throughout the year as plants grow and die. When this happens, a rating adjustment is needed to ensure the streamflow is reported correctly to the public. To adjust the curve, a new manual streamflow measurement is required. The U.S. Geological Survey (USGS) operates and maintains all major streamflow gages in the Henry’s Fork watershed. But plants often grow/die faster than USGS can get in the field to re-measure streamflow and adjust the rating curves. As a result, the USGS gage may be off by up to 100 cfs! But every drop matters every day. So we measure streamflow when USGS cannot and report our adjustment to water managers. This improves water management precision in the watershed.


Did you know that sometimes the river can be different depths at the same flow? Underwater plant growth makes the river deeper, even if streamflow stays the same. On the flipside, did you know the river can be the same depth at different flows? Plants can maintain stream depth, even when streamflow drops!
HFF-installed streamflow gages. USGS has 14 gages in the Henry’s Fork watershed. These are incredibly important! But there are some locations where a USGS gage is not (or no longer) installed that are important for precision management. So HFF has installed streamflow gages at additional locations in the watershed to really hone our precision management goals across a greater area. We measure streamflow at these locations to create our own rating curves. These rating curves are important for translating the stream gage data.
Where does HFF measure streamflow and how often?
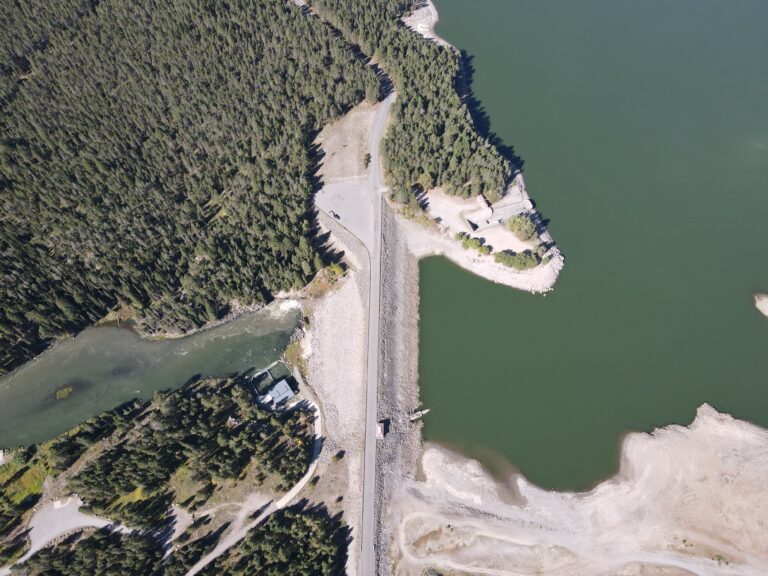
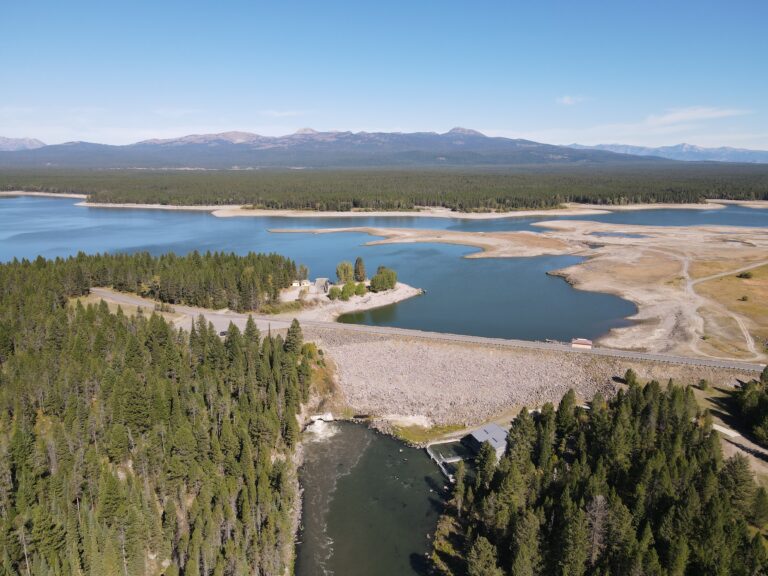
We measure two locations associated with USGS streamflow gages: Island Park Dam (at the Box Canyon put-in) and Ashton Dam (at the Ora Bridge put-in). You can find us measuring streamflow at Island Park most Friday mornings in July through November. In 2023, we did 14 measurements at Island Park. We measure Ashton Dam once every 2–3 weeks during that same time frame. In 2023, we did 6 measurements at Ashton.
We measure three locations associated with HFF-specific gage sites:
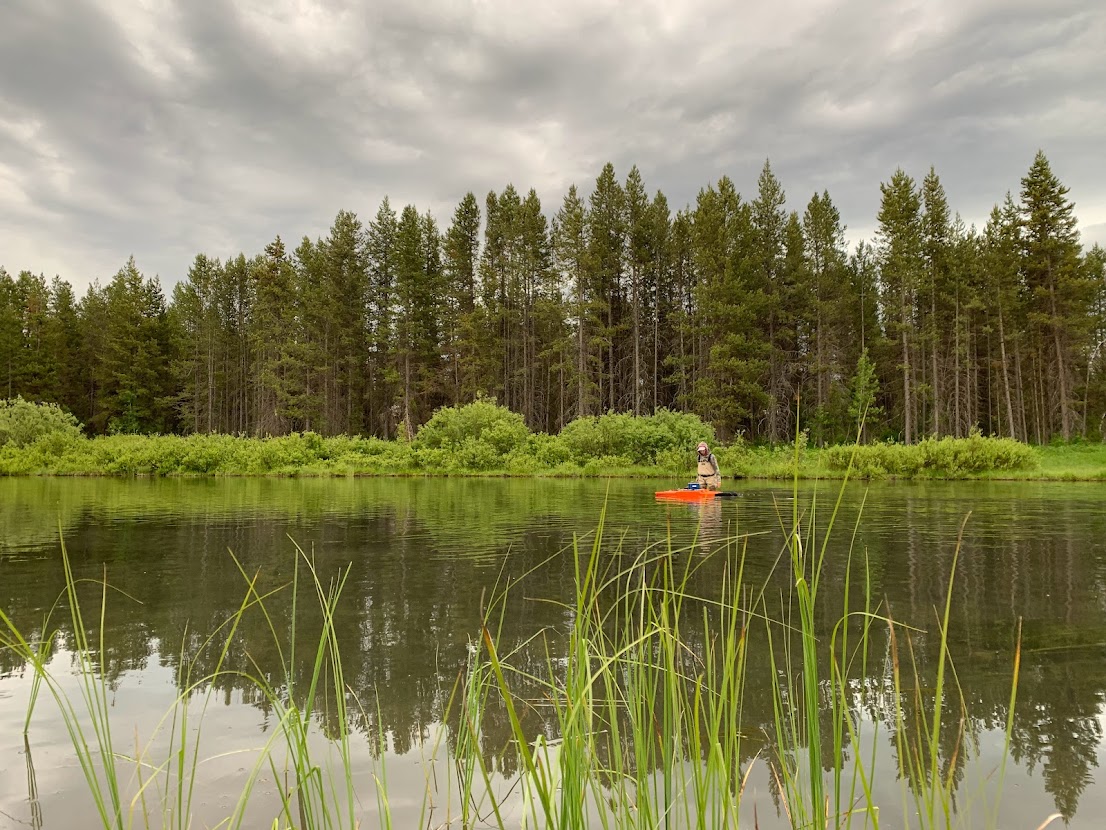
- Buffalo River (upstream of the Hwy 20 bridge). The Buffalo River is an unregulated headwater spring fed by the Yellowstone Plateau Aquifer. USGS began the gaging effort in 1935 and continued through 2005. USGS and Fall River Rural Electric Cooperative partnered on maintaining the gage through August 2016, when HFF took over the effort. HFF installed our real-time transducer in April 2022. We make measurements once each month and made 12 measurements in 2023.
- Parker-Salem / Red Road Bridge (downstream of St. Anthony; location of the low-flow target). We started measuring streamflow at this location in 2019. In 2023, we analyzed several years of data and observed that streamflow was equal to nominal flow (calculated as flow at St. Anthony minus four downstream diversions). We only made 4 measurements in 2023 and anticipate continuing to make 4–6 measurements per year.
- Harrops Bridge (northern end of Teton Valley). USGS installed a gaging station at this location in 1929 and operated it on and off through 1957. HFF began maintaining the gage in 2016 by request of Friends of the Teton River and their partners to monitor groundwater inputs to the Teton River. We made 9 measurements here in 2023.


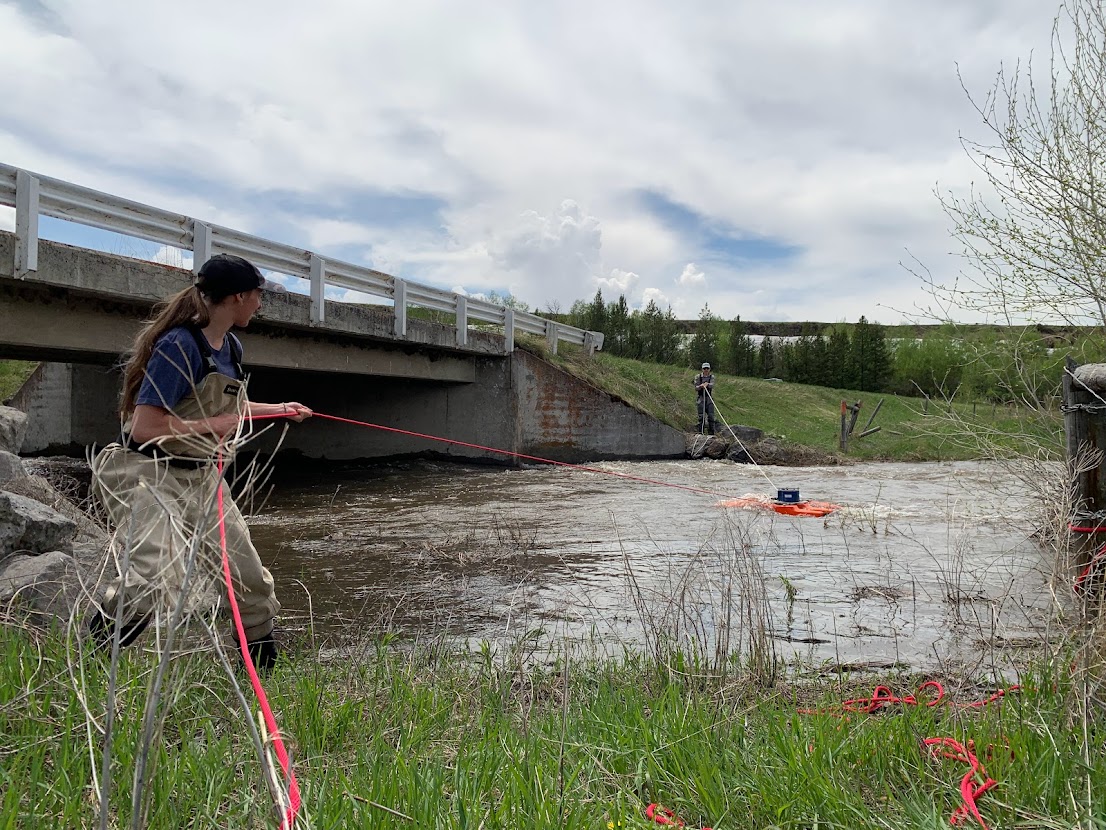
Measurement at the Buffalo River in June 2023 (top); measurement on Conant Creek at peak flow in May 2023 (bottom).
We have also measured streamflow regularly at two other locations associated with specific irrigation operations and projects.
- North Fork Teton at the Splitter (where the Teton River splits into the North and South Forks). We first installed a gage here in 2020 to support FMID’s operation of a remote-controlled headgate at the splitter. After installing the gage, we made 5 measurements at 5 different gate settings to establish the initial rating curve. Then we made 5 more measurements at different flows throughout the rest of the 2020 irrigation season. We made 2 measurements in each of 2021 and 2022 to verify that the channel was stable and the rating was still valid. We did not make any measurements in 2023 because FMID reported that the rating was still valid. We have handed over all operation of that gage to FMID and will make additional measurements there if they request it.
- Conant Creek (near the Fall River confluence; approx. location for privacy). We established a gage here (in cooperation with a willing landowner) in 2022 and made 9 measurements there in the fall of 2022 and spring/summer of 2023. Two of the nine were made with a flowmeter because the flow was too low for the ADCP unit. This monitoring is being done in conjunction with infrastructure improvements being made to the Conant Creek Canal to improve water delivery and streamflow in Conant Creek as part of our Farms and Fish program.

How do we measure streamflow? Introducing Matilda, the ADCP
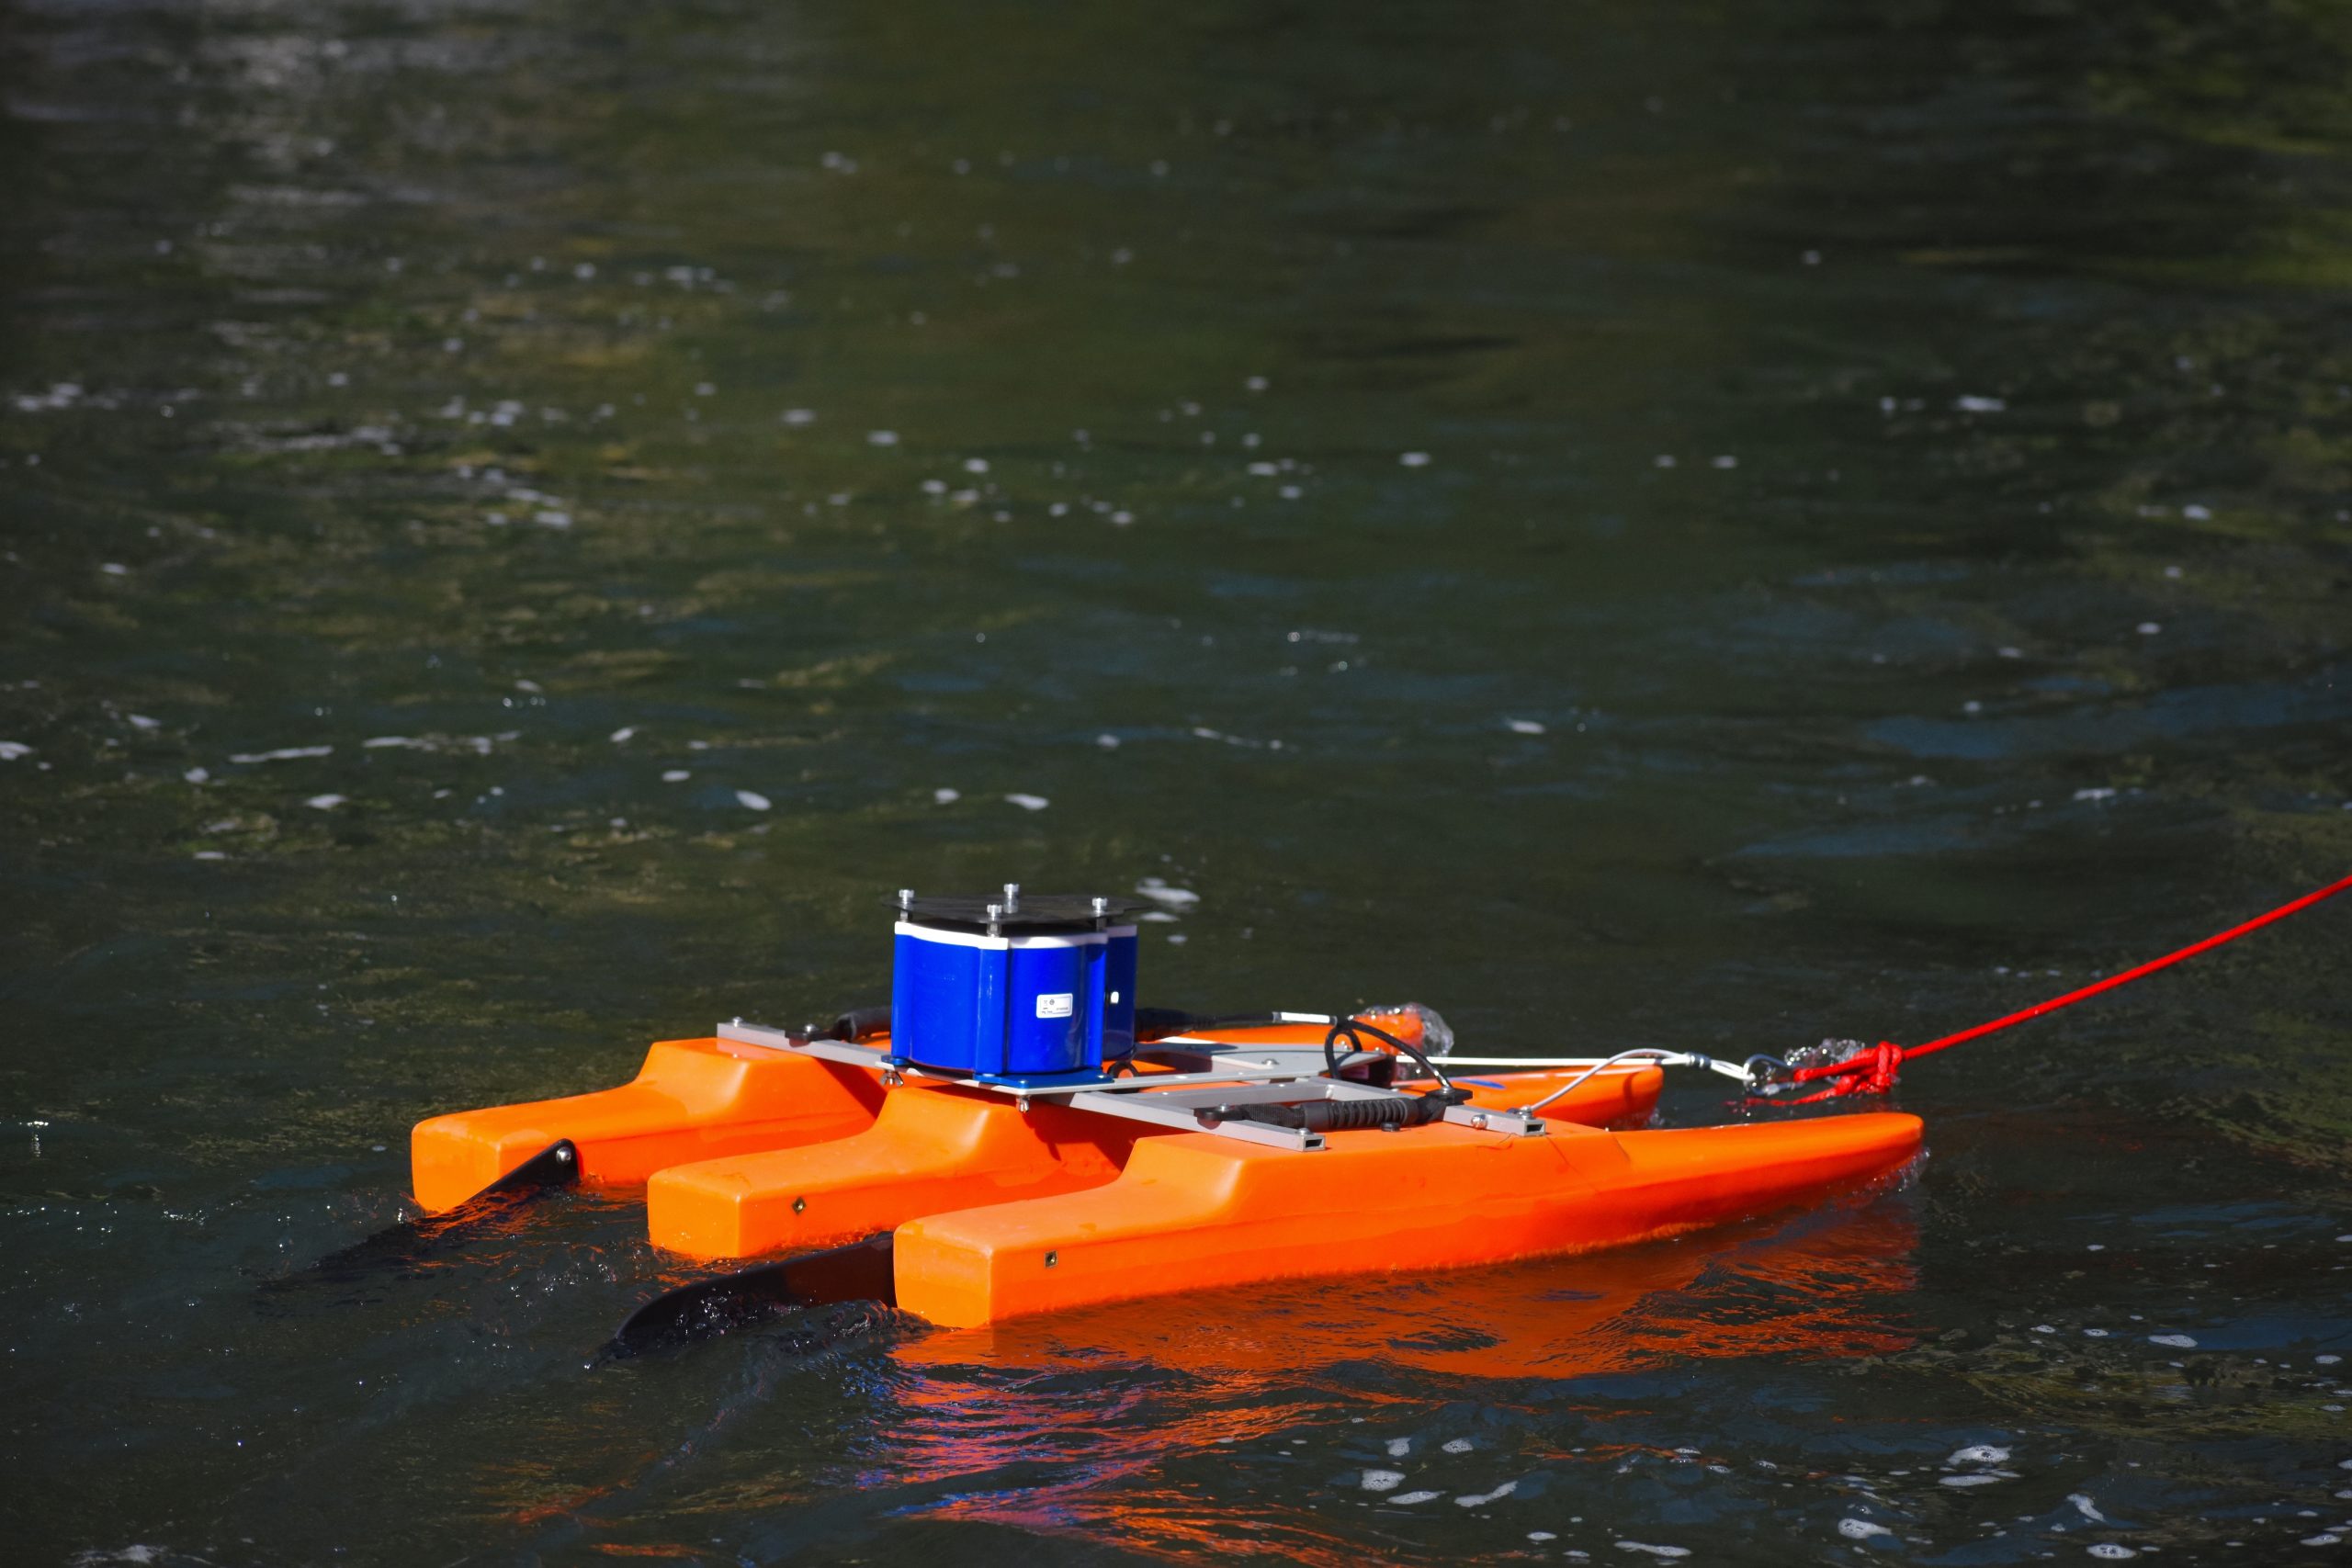
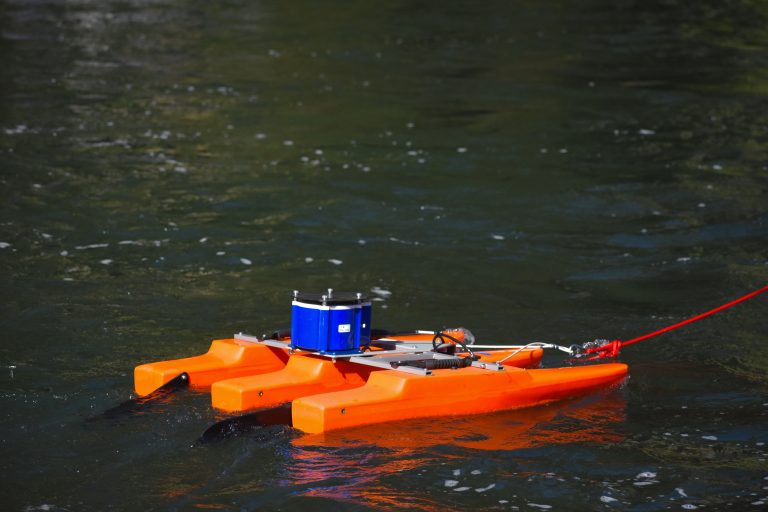
HFF previously measured streamflow in smaller creeks and streams with a wading rod and tape measure. But measuring streamflow in a river as deep and wide as the mainstem Henry’s Fork required heftier equipment and some creativity. As such, HFF partnered with Fremont-Madison Irrigation District (FMID) in 2018 to purchase an Acoustic Doppler Current Profiler (ADCP). Per the arrangement, FMID purchased the $30,000 ADCP and loans it to HFF. An intern from Colgate named the ADCP Matilda in 2018 after the children’s book character who has superpowers and can be stubborn sometimes.
What is an ADCP and how does it work?
An Acoustic Doppler Current Profiler (ADCP) is an instrument that uses sound waves to measure how fast water is moving and how deep the river channel is. Streamflow (cubic feet/second) is equal to channel width (ft) * channel depth (ft) * channel velocity (ft/s). Paired with some user input data (like starting distance from the water’s edge), the ADCP is equipped to collect data on each of those components and compute a discharge measurement.
To measure discharge, we move the ADCP in (at least) four transects across the river. For example, we’ll start on the left bank and move towards the right bank, then right bank to left bank, and then repeat. The ADCP computes the average of the four transects to output a discharge measurement and its associated error. As the ADCP moves from bank to bank, it uses Bluetooth connection to store, visualize, and communicate its data in real-time on a laptop. See the output below. The channel bottom is shown in the dark black line; the squares show velocity at different depths as we move across the river channel.
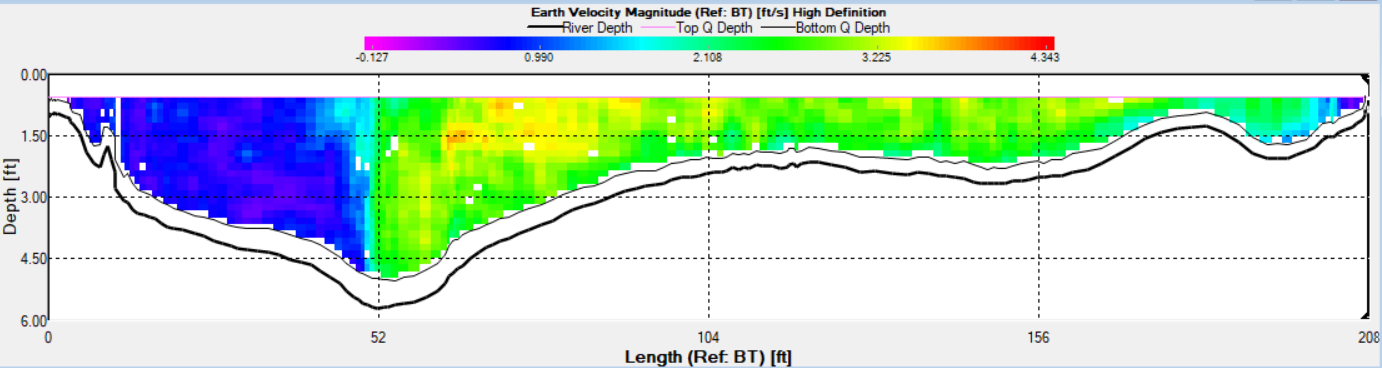
This is a transect taken upstream of the Parker-Salem bridge on the lower Henry’s Fork on June 24, 2020. We measured streamflow at 1,050 cfs across the four transects, with an error of 2%. Notice how there is a slow pool on the left side of the river channel and that most channel velocity exists in the middle of the channel.
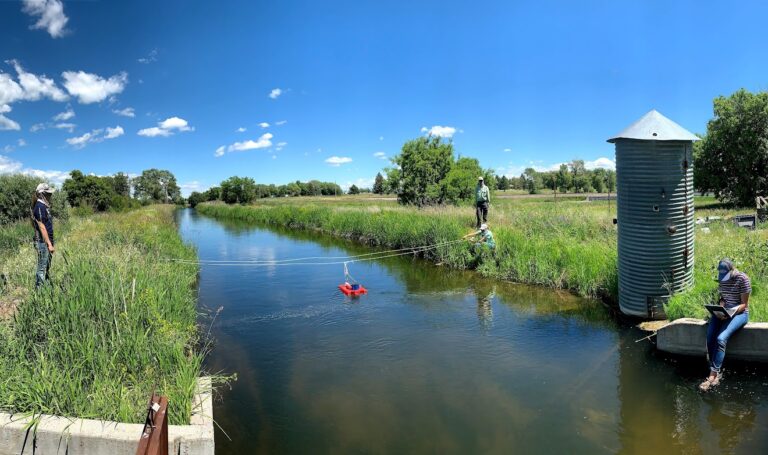

There are many techniques for deploying the ADCP. The U.S. Geological Survey uses cableways and sometimes bridges. At the Henry’s Fork Foundation, we deploy the ADCP by pulley, boat, and walking.
- Pulleys work well for uniform channels that aren’t too wide, like canals.
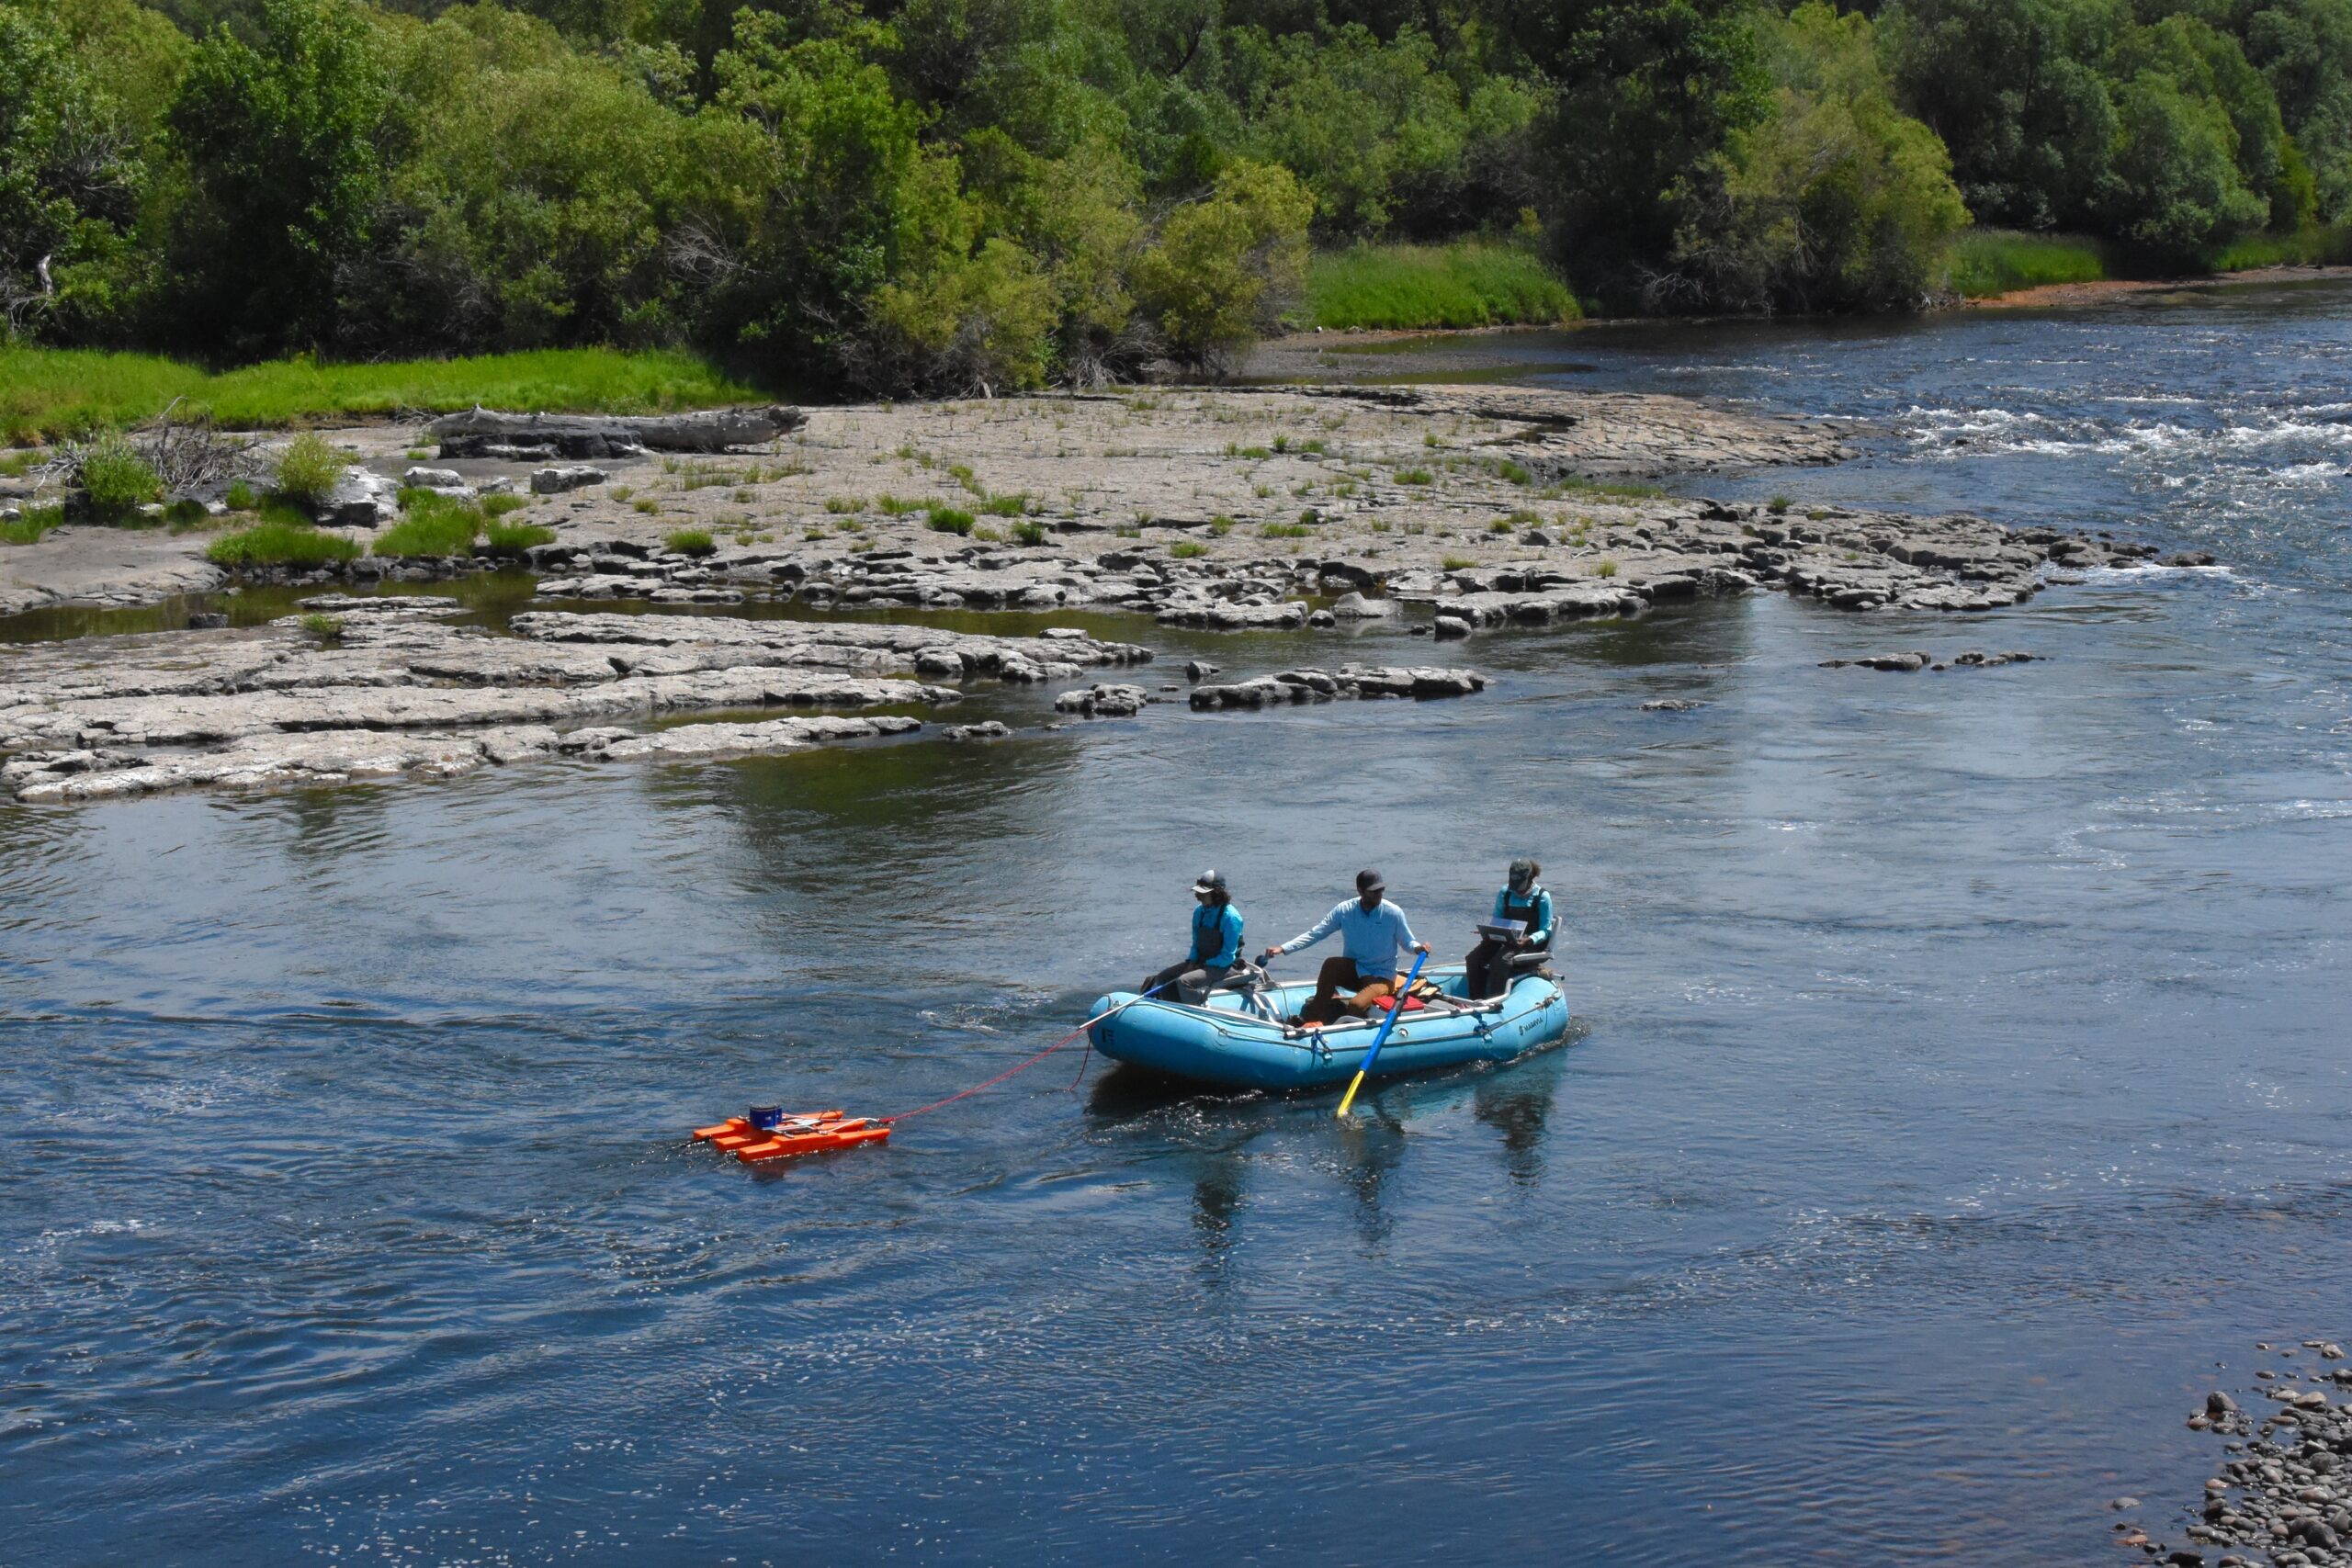
- Deploying the ADCP from a boat is necessary in deep and swift river channels (like the Box Canyon put-in, at 1,000 cfs). This deployment technique requires a team of three: someone to row, someone to manage the computer, and someone to manage the ADCP from the bow.
- Walking the ADCP works well when the river is shallow (like the Buffalo River). We use a broomstick and rope to guide the ADCP across the river. Both the pulley and walking work well with a team of two.
How good are our measurements (compared to USGS)?
All gaging is only accurate within 10% of true streamflow.
- Mean bias—On average, are we higher or lower than USGS? In 2023, we measured streamflow 0.66% lower than USGS at Ashton and 0.9% higher at Island Park. Therefore, we tended to underestimate streamflow at Ashton and overestimate streamflow at Island Park.
- Mean absolute error—On a given day, how far off was an individual HFF measurement compared to USGS? In 2023, on average, we were off by 95 cfs at Ashton and 29 cfs at Island Park. The river has a lot more water in it at Ashton compared to Island Park, so the 95 cfs difference is small compared to actual streamflow.
- Mean absolute relative error—Divide the value above by the value reported by USGS. In 2023, on average, our measurements at Island Park were off by 5.6% (a small amount). This value was higher than 2022, when our measurements were off by 4.9% (an even smaller amount). At Ashton, our measurements were off by 5.8% (also a small amount). These are all within the 10% accuracy of USGS. So, we’re doing pretty well!
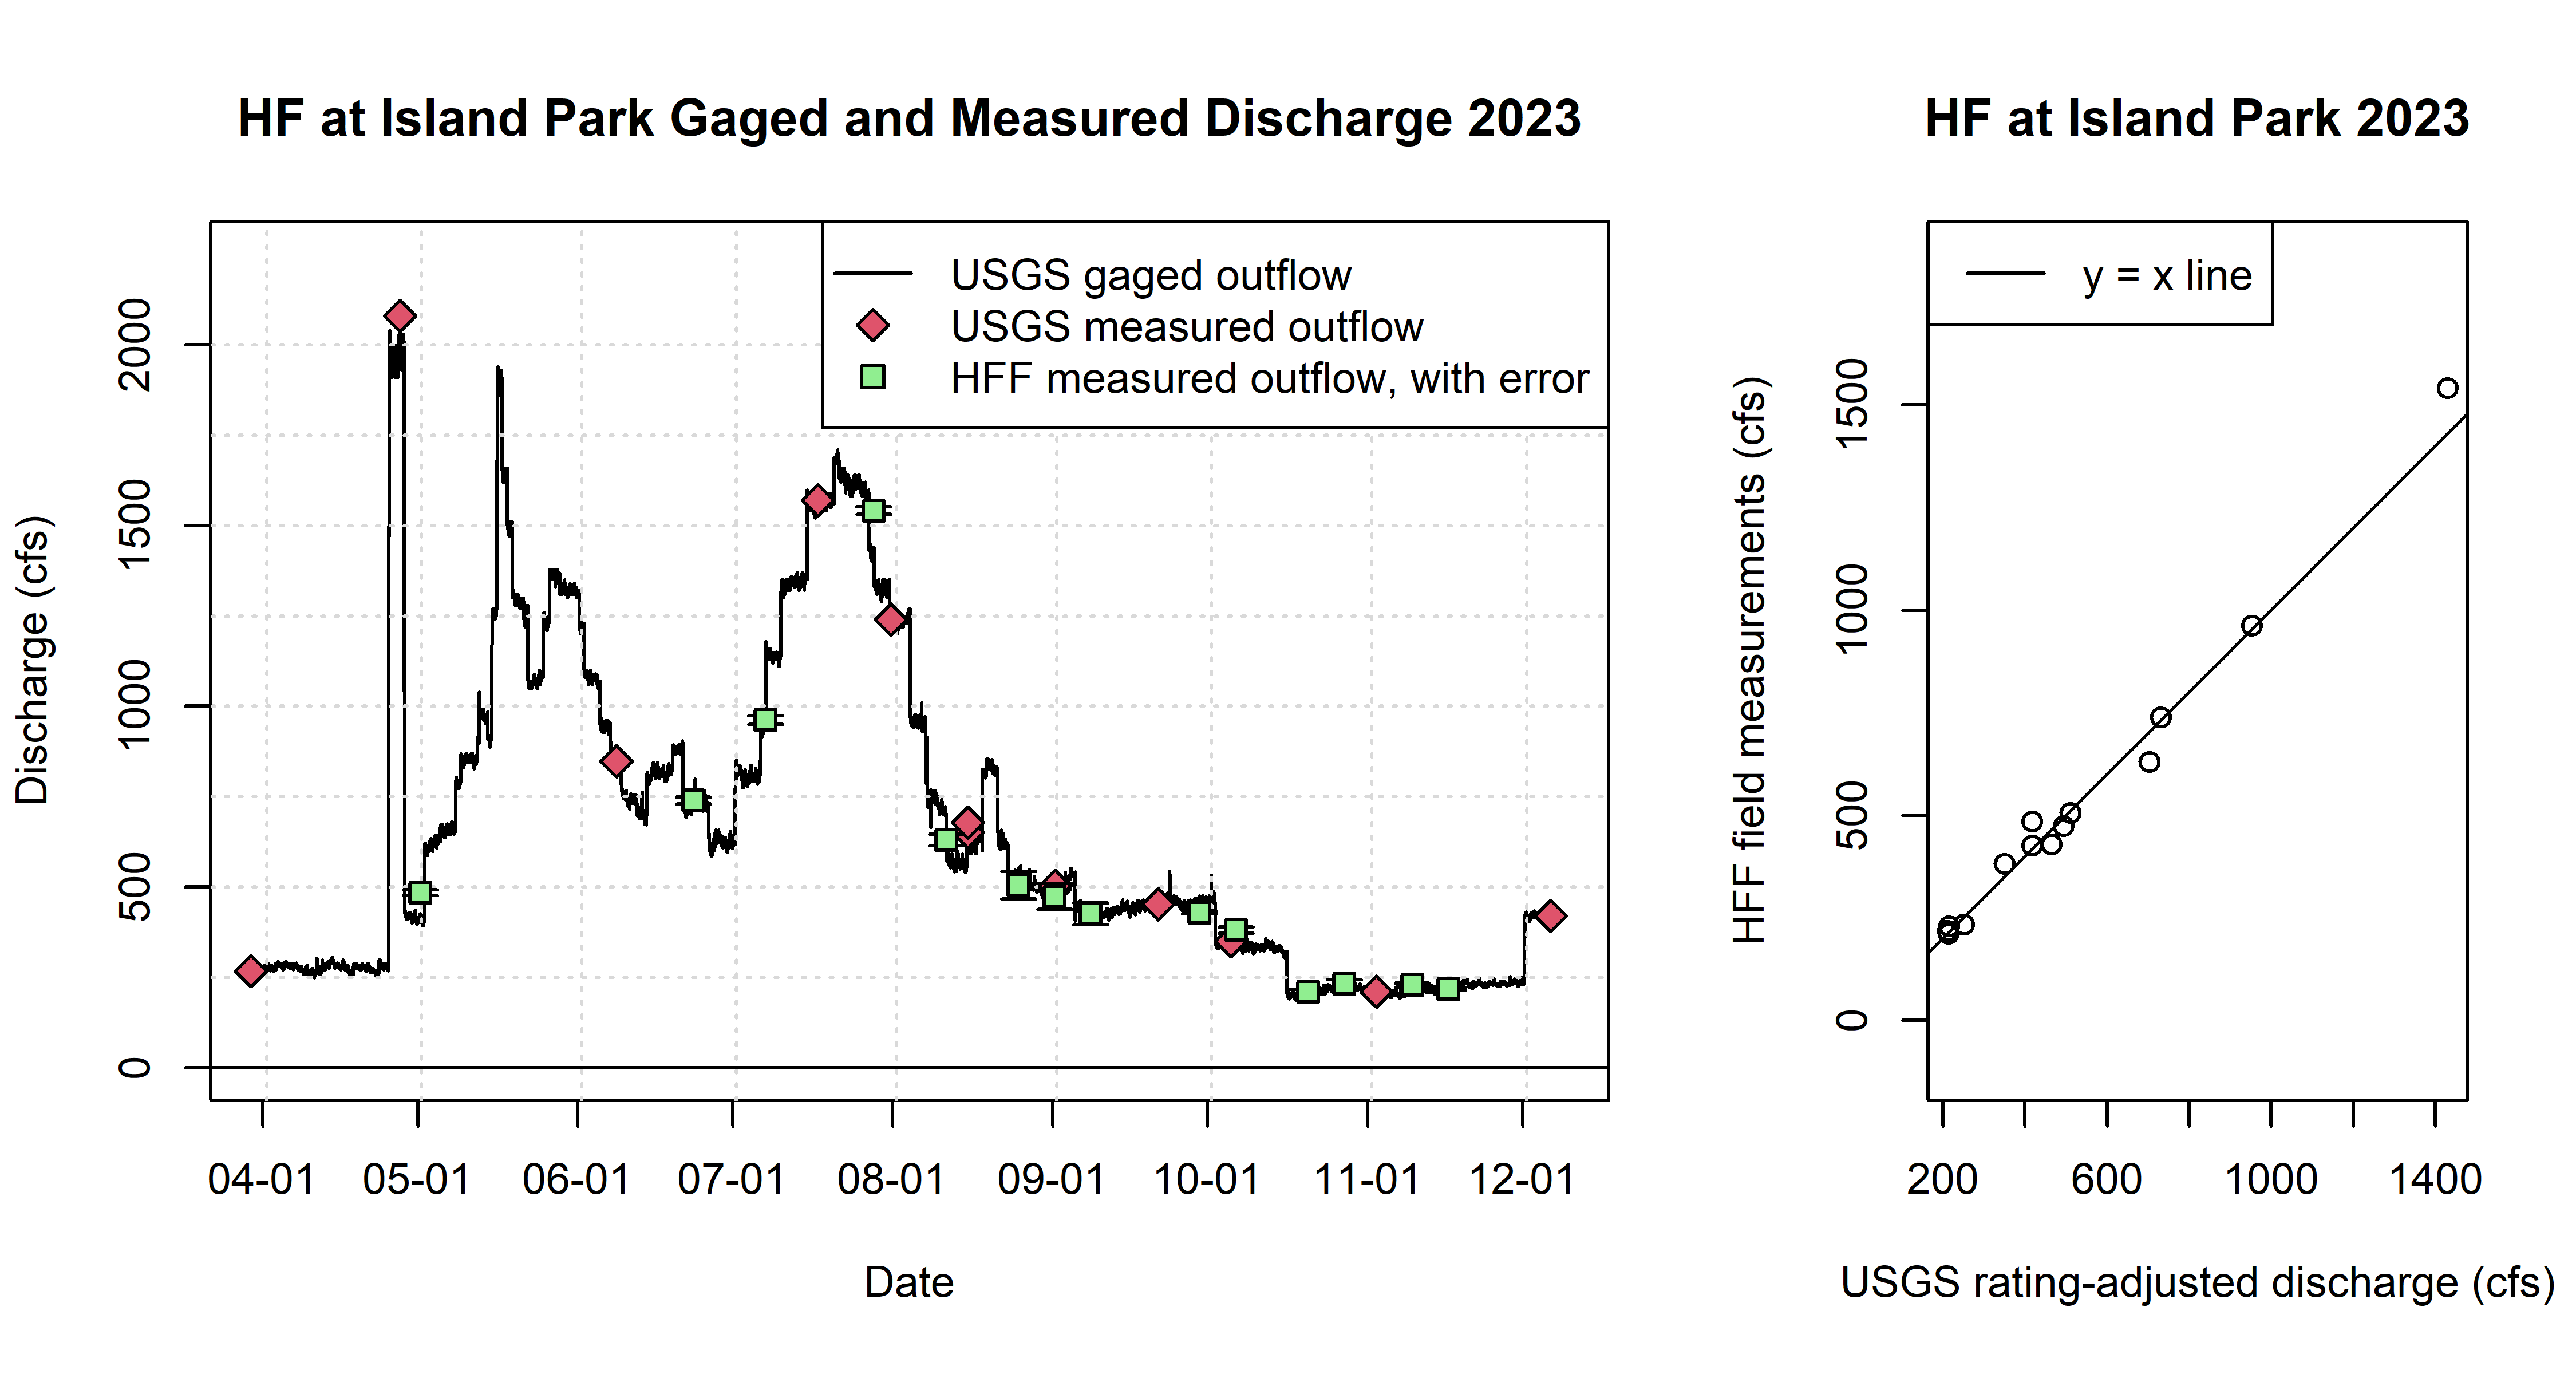
HFF and USGS streamflow measurements April 1 to December 1, 2023 downstream of Island Park Dam (top). Comparison of 2023 HFF field measurements to the streamflow reported by USGS when adjusted (bottom).
The streamflow measurement team at HFF continues to hone our technique. Although these measurements come with error, they are closer to true streamflow than what is reported online when USGS has yet to shift their rating. In the next year, we hope to expand our training so our measurements better match that of USGS.
Impact
From 2018–2023, HFF’s Precision Management Program has saved 26,000 acre-ft in Island Park Reservoir on average. Although we haven’t teased out how much streamflow gaging specifically contributes to these water savings, we know that measuring streamflow is incredibly important. HFF’s gages at the Splitter and Parker ensure irrigation deliveries downstream are meeting demand and management goals as precisely as possible. Monitoring streamflow on the Buffalo River gives us long-term information important for understanding base flow conditions connected to the Yellowstone Plateau. HFF uses all our streamflow measurements together to estimate upcoming winter inflow. These measurements allow us to generate more accurate predictions important for creating water management strategies. These measurements also allow us to better monitor descent into drought and recovery from drought. In sum, our streamflow measurement efforts further solidify our role as a science-based collaborator in the region. If you would like to join us to shadow a measurement in person, please contact HFF’s Outreach and Communications Coordinator, Jasper Davis (jasper@henrysfork.org).
We’re incredibly grateful for our partnership with Fremont-Madison Irrigation District in making this work possible. As of 2023, we have completed our fifth summer of these efforts and we learn more every year.