- Winter flow at Island Park Dam is the single biggest management factor determining trout recruitment in the Henry’s Fork downstream of the dam.
- Flow this winter is projected to be 330 cfs, compared with the 1978-2020 average of 360 cfs.
- Including this projected value for 2021, winter flow during 2019-2021 will still be the highest three-year average in 20 years.
- Due to improved water management, winter flow has been increasing since the 1970s.
What is “winter flow and how does it affect trout?”
Idaho Department of Fish and Game, HFF and others have done extensive statistical analysis of variables that affect recruitment of juvenile rainbow trout into the population downstream of Island Park Dam, and the only thing that strongly predicts recruitment is streamflow through Box Canyon during the coldest 90-period of the winter. Not knowing ahead of time what the coldest period will be in any given year, we use the statistically coldest period, which is December 1 – February 28. Also, although the Buffalo River flow is a substantial fraction of total flow in Box Canyon, nobody has control over that. So, from a management standpoint, we refer to “winter flow” as the December 1 – February 28 mean outflow from Island Park Reservoir, as measured by the U.S. Geological Survey stream gage immediately downstream. In this blog, “winter flow” refers to this streamflow quantity.
From finer-scale research of fish physiology, behavior, and habitat needs, we know that juvenile trout metabolism becomes so low during extended periods of cold water temperatures that they are unable to react and swim fast enough to avoid predators. During the period of low metabolism, survival of juvenile trout depends on their ability to find cover in which to completely conceal themselves from predators. In general, this type of cover is provided by spaces in cobble/boulder substrate on the stream bottom and along the banks, complex woody debris, and dense aquatic vegetation. The latter is a great source of concealment habitat in the Henry’s Fork between Last Chance and Pinehaven during the late summer and early fall, when vegetation is abundant. Furthermore, dense aquatic vegetation maintains greater water depth at a given stream discharge. However, aquatic vegetation starts to die off and be eaten by waterfowl in October, so its abundance steadily decreases throughout the fall. This not only reduces the physical cover itself but also reduces river depth. Once vegetation is largely gone, the only cover left is the cobble/boulder substrate and woody debris. There is very little of this present between Last Chance and Pinehaven, so the fish move either into Box Canyon or down into the Riverside-Mesa Falls reach. The availability of this type of habitat in those reaches is directly related to streamflow.
How can winter flow be maximized?
On average, draft of Island Park Reservoir is no longer needed to meet irrigation demand after mid-September. Thus, reservoir fill can usually begin in late September. As long as ice covers the reservoir, content must stay below around 120,000-122,000 ac-ft (89% full) to prevent ice scour on spillway infrastructure. Once ice cover is gone–as early as mid-April–the remaining 15,000 ac-ft can be filled. So, this roughly leaves the period between late September and early April to fill the reservoir to around 120,000 ac-ft. During the period of fill, reservoir outflow must be lower than inflow.
Of course one way to maximize outflow and still fill the reservoir is to end irrigation season with a relatively full reservoir. Reservoir draft is minimized by managing water precisely throughout the whole irrigation system to deliver just enough water to meet irrigation demand and meet low-flow targets in the Teton River and Henry’s Fork downstream. However, once irrigation season is over, the reservoir must be filled, regardless of what happened during the summer.
Prior to the early 1970s, the reservoir was filled by setting outflow to 0 in mid-November and storing all inflow. This results in very rapid fill during the winter but very low flow through Box Canyon. In some states such as Colorado, water-rights accounting procedures require such fill strategies–all available inflow must be stored when a particular reservoir’s water right is in priority. In the case of Island Park, this would often result in 0 outflow from late winter through mid-June, which is usually when its water right is in priority. Fortunately, flexibility in water-rights accounting in the upper Snake River system usually allows fill of Island Park Reservoir to be determined locally by the Henry’s Fork Drought Management Planning Committee to meet needs within the watershed. Water stored in Island Park early in the winter actually belongs to American Falls on paper, but that physical water can be delivered downstream later in the winter or spring without losing it from the upper Snake River system.
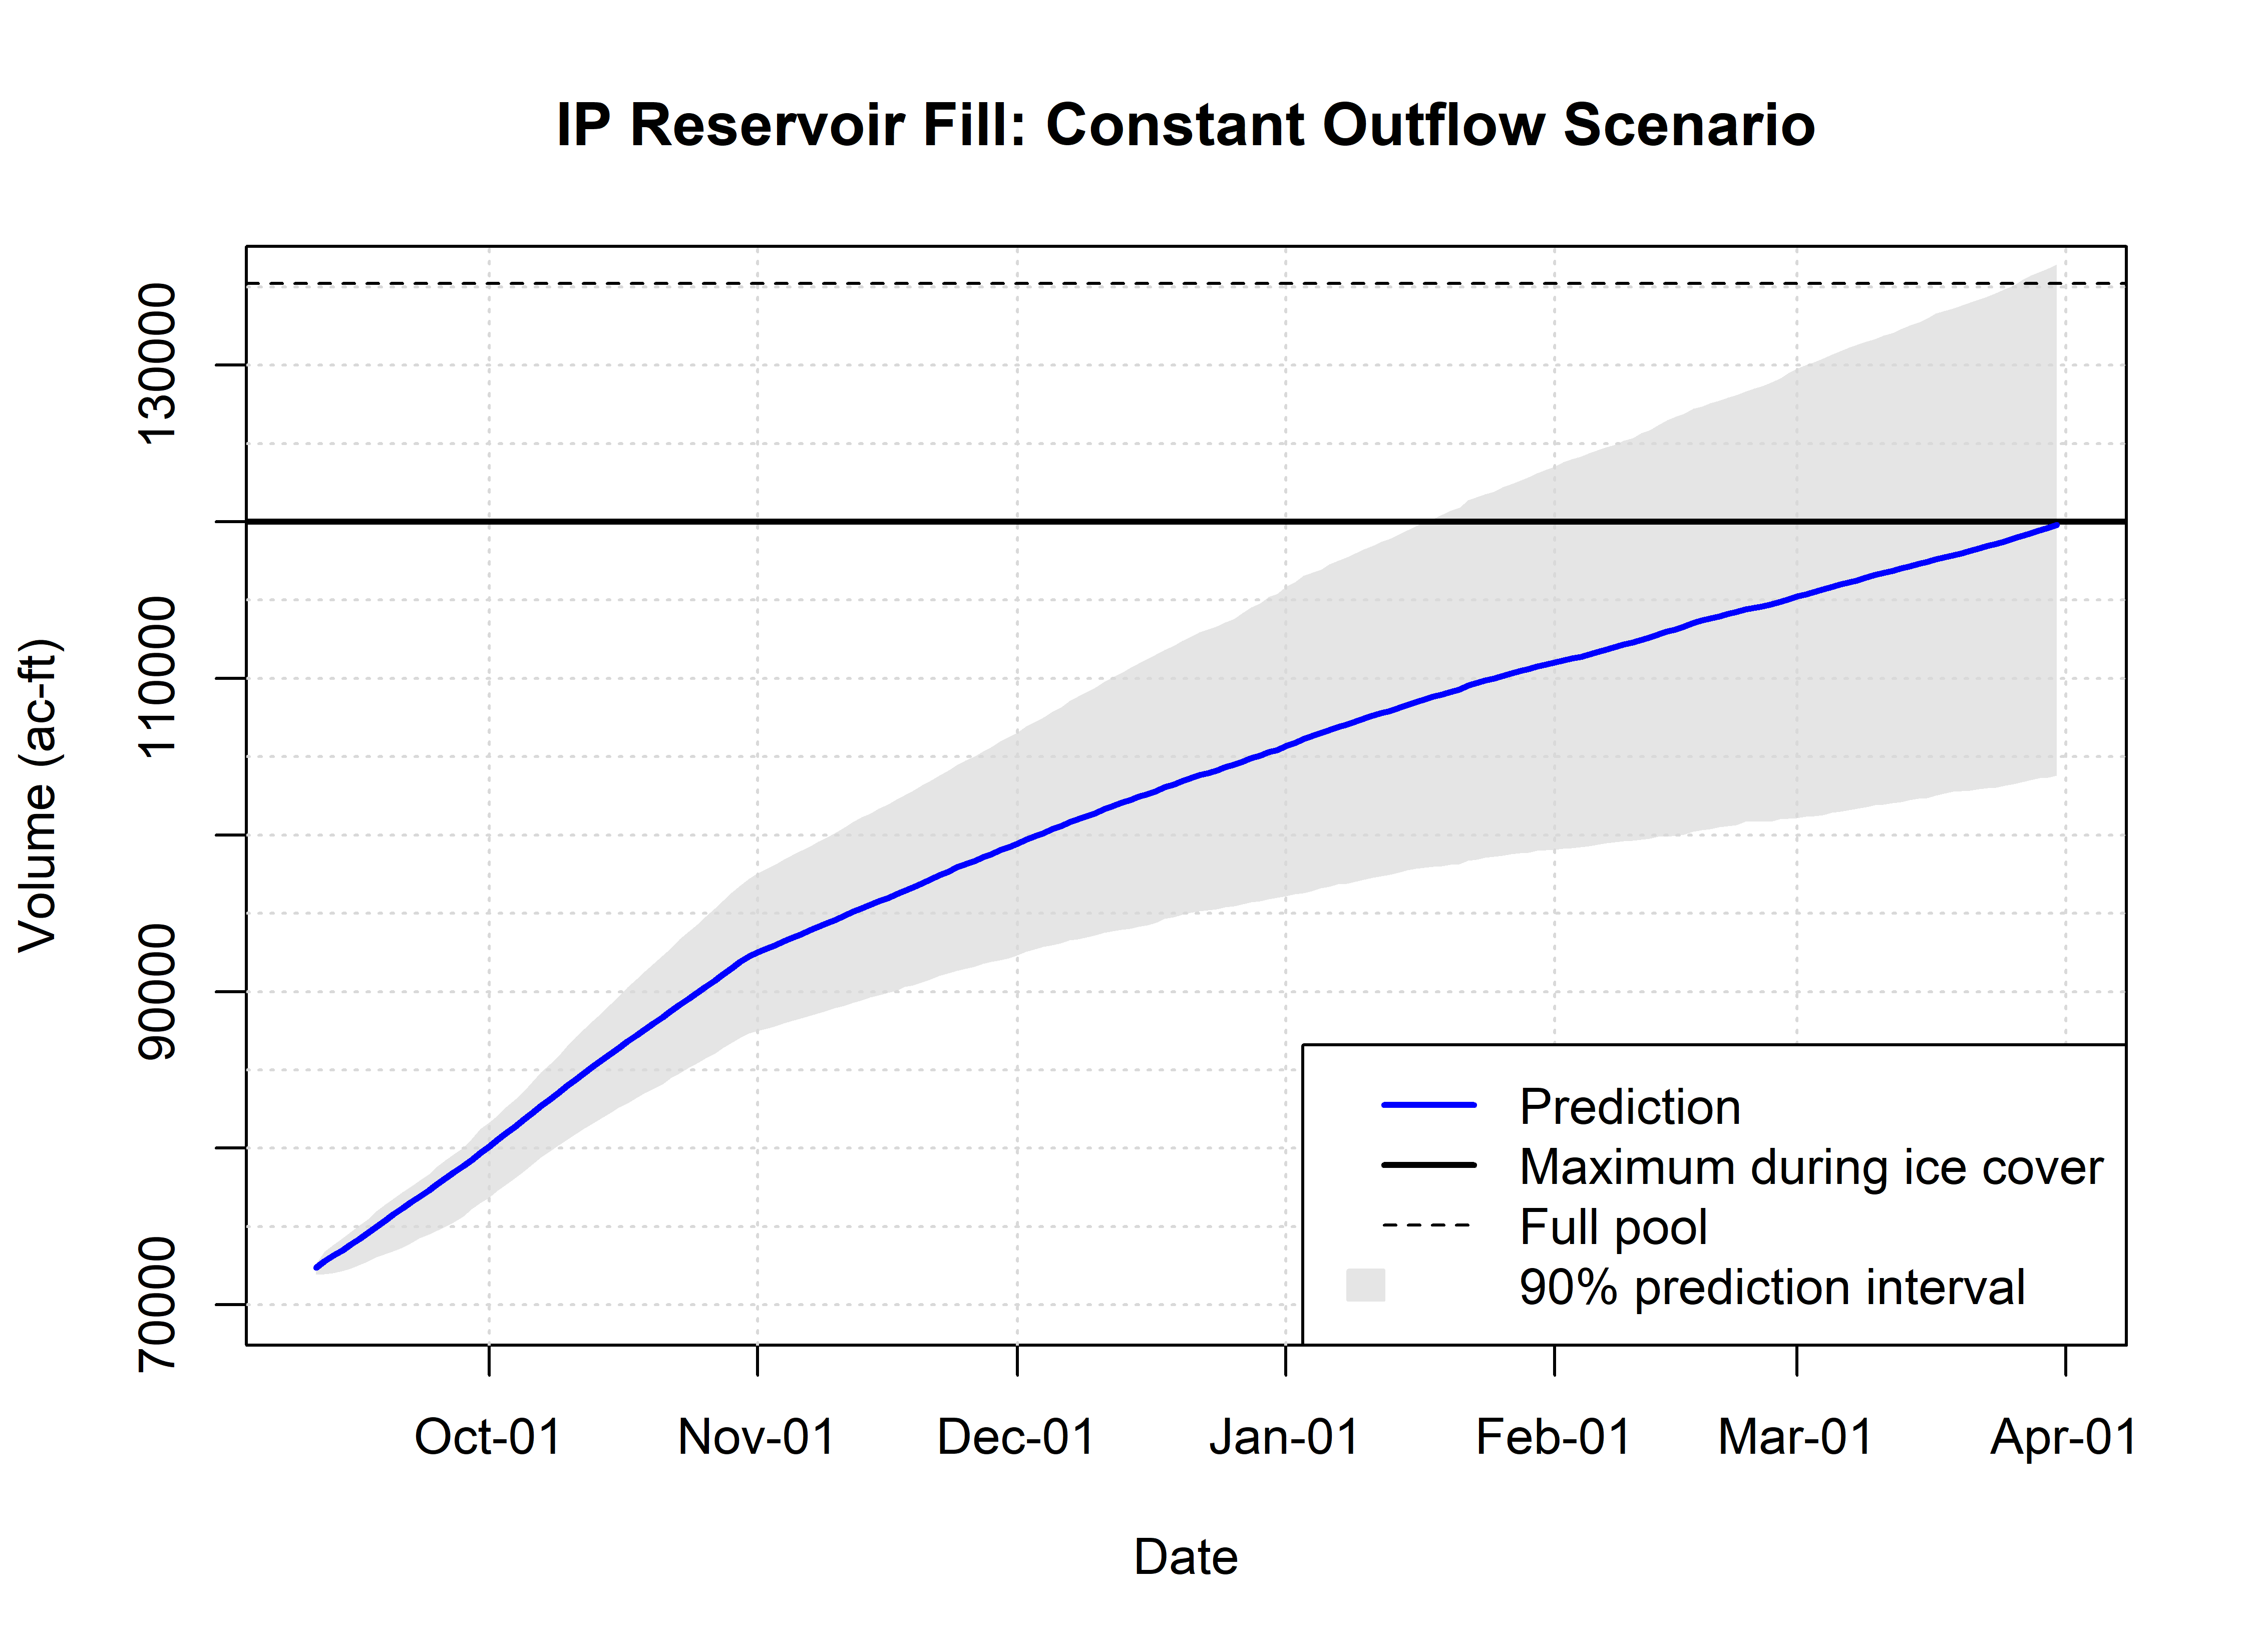
Starting in the early 1970s, fill strategy for Island Park Reservoir changed to allow storage early in the fall, once draft was no longer needed to meet demand. This was done through a formal agreement among numerous parties to provide higher flows during the winter for hydroelectric power generation downstream at Ashton and Idaho Falls. The fill strategy was what I call “constant outflow.” In this strategy, reservoir outflow is set at a constant value from late September until the reservoir reaches its April 1 target. This outflow is determined by estimating winter inflow to the reservoir and then dividing the needed fill volume by number of days to fill. Outflow is then equal to inflow minus the required daily fill rate. At a constant outflow, the reservoir will fill at roughly a constant rate throughout the winter.
The graph below provides my September projection of what constant outflow would have looked like this winter. The decrease in fill rate seen around November 1 is due to decrease in outflow at Henry’s Lake, which decreases inflow to Island Park a little.
A third strategy is to fill the reservoir at a faster rate during the fall so that fill rate can be slower during the middle of the winter. This requires a lower outflow during the fall but allows a higher winter outflow, relative to the strategy of setting a constant outflow. This strategy has been used formally since 2005, when the Henry’s Fork Drought Management Plan was approved. The Henry’s Fork Drought Management Planning Committee meets in the fall to assess conditions and set a strategy for filling the reservoir that allows higher winter flow than would be possible under either of the two strategies above. In most years, flow is reduced once draft of the reservoir is no longer needed to a value that allows some storage but also provides sufficient streamflow for late-season irrigation demand and good fall fishing. After a few weeks at that flow, which was around 330 cfs in 2020, outflow is reduced even more to increase the fill rate. Except in extreme years such as 2016, when the reservoir was drafted to only 15% full, fall outflow is usually set at least high enough to allow the Island Park hydroelectric plant to operate. The minimum operating flow is 200 cfs, which is roughly where October-November flow was set this fall. Outflow is then increased on December 1 to a higher level, but one that will allow the reservoir to reach its April 1 target.
One question I often get is “why is 200 cfs ok in the fall but not in the winter?” or some variation on that expressing concern about low flows in the fall. There are three parts to the answer. First, water temperatures are much higher in October and November, so juvenile fish metabolism is high enough that they can avoid predation without requiring concealment cover. For example, water temperature at Pinehaven ranges between 35 and 55 degrees Fahrenheit in October and November but only between 32 and 35 degrees from December through February. Second, as mentioned above, aquatic vegetation provides both cover and water depth during October and November, so that the same or even more cover is available at 200 cfs in October than at 350 cfs in the middle of the winter. Lastly, we have found no statistical relationship between streamflow during October and November and trout recruitment or population size, whereas there is a positive relationship between winter flow and trout recruitment. Thus, for a given reservoir fill need, the trout population benefits from a strategy in which outflow is lower in October and November and higher from December onward.
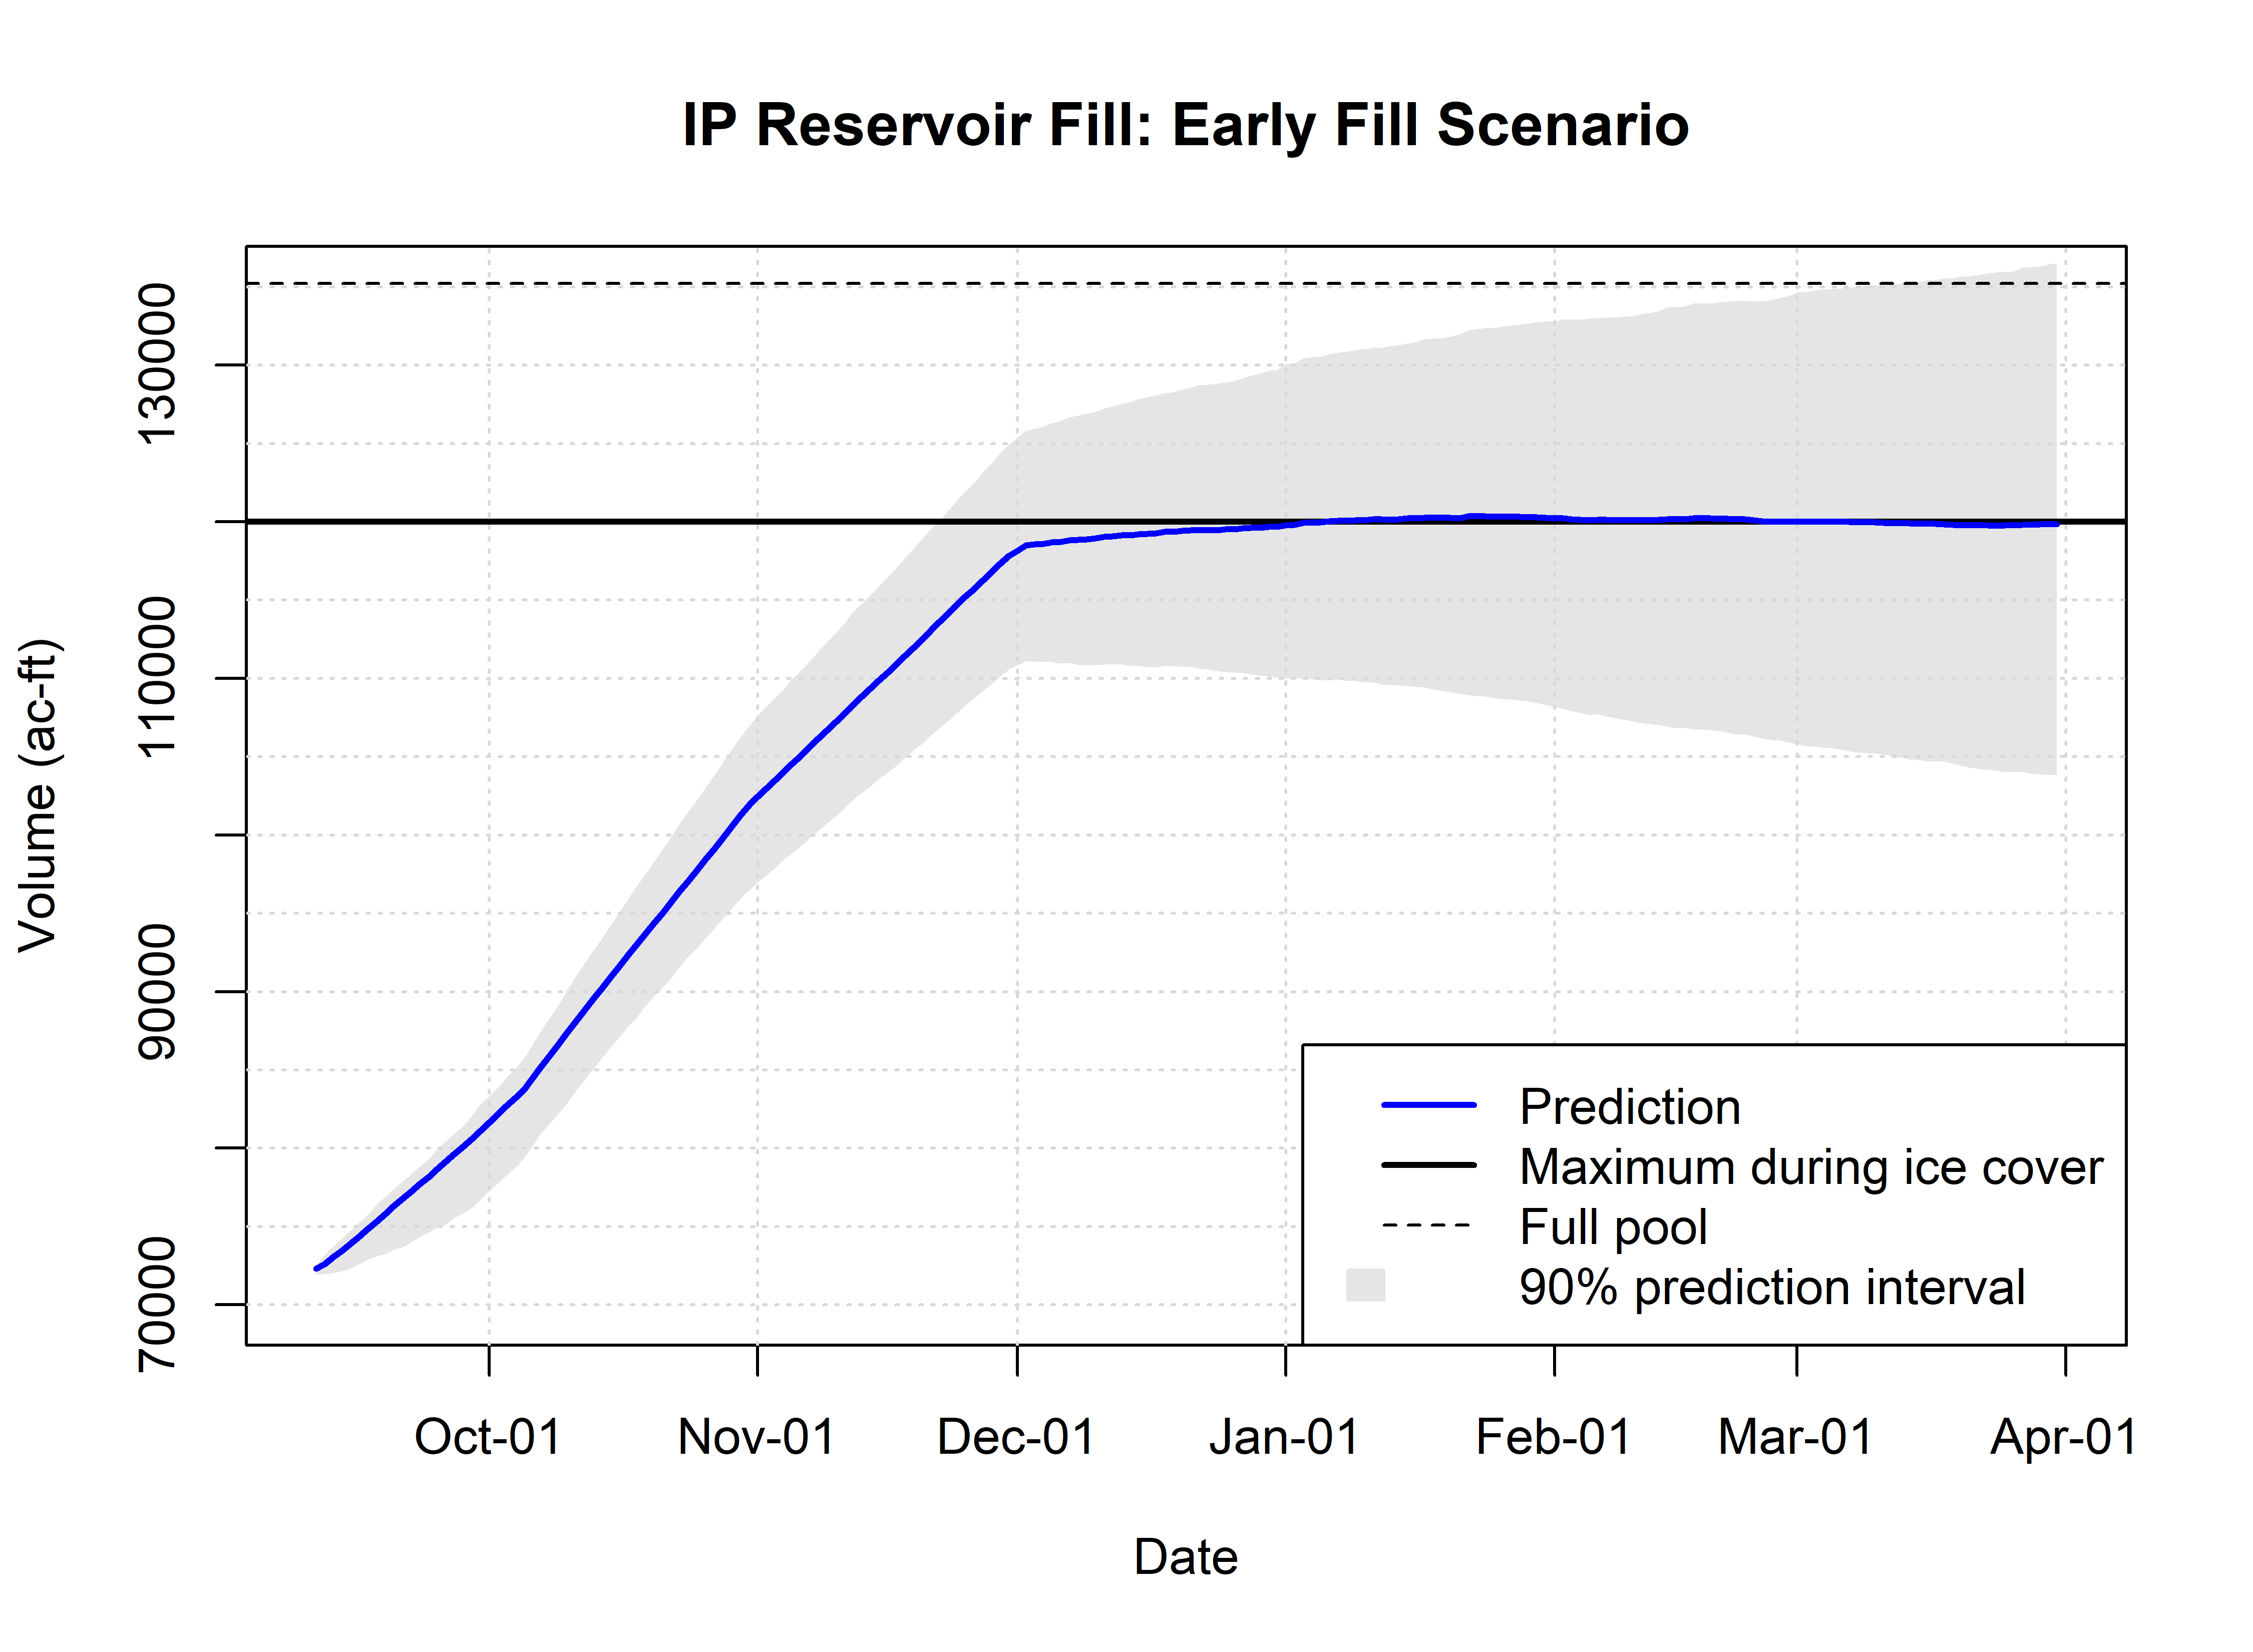
The graph below shows my September projection of what that scenario would look like this winter. It was based on a projected outflow of 300 cfs from mid-September to early October, followed by 200 cfs until December 1 and around 425 cfs after that. This is the scenario implemented by the Drought Management Planning committee in mid-September.
Projected winter flow for 2020-2021
Unfortunately, very dry conditions during late September and early October greatly reduced the amount of reservoir fill early in the fall, as shown in the graph below, which was made in mid-November.
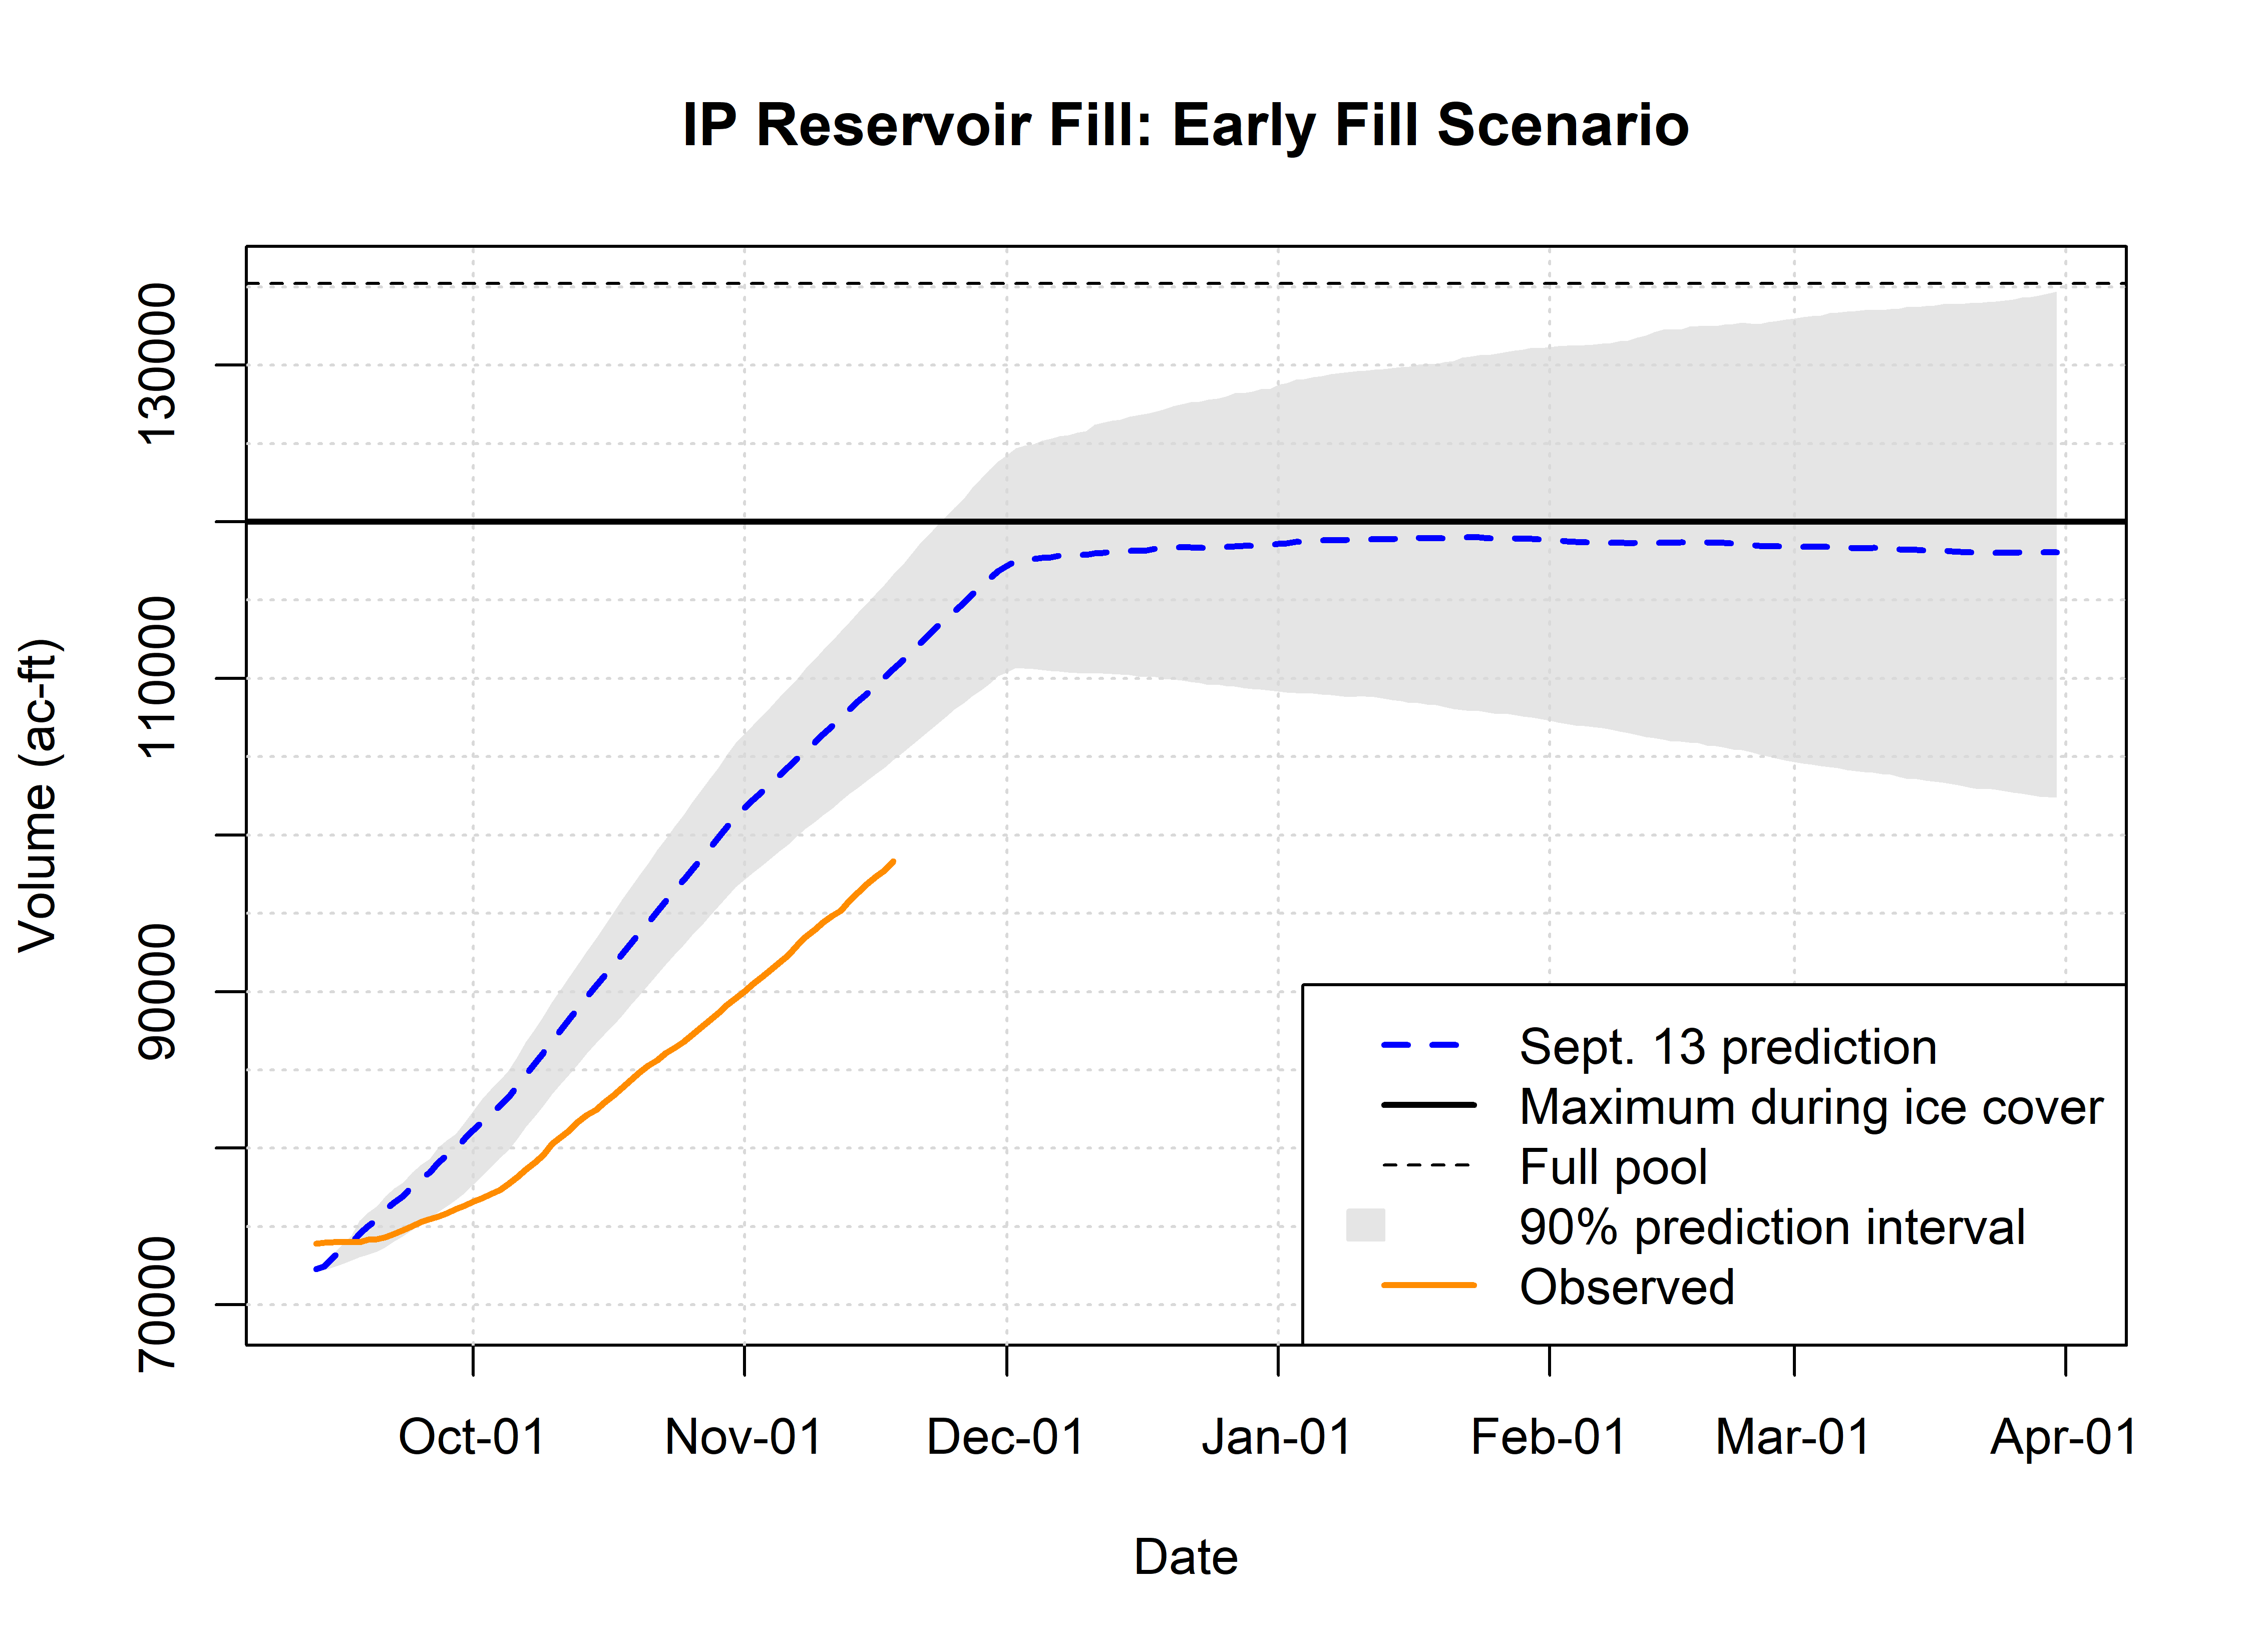
As a result, the Henry’s Fork Drought Management Planning Committee met again in mid-November and revised the target winter outflow from Island Park Reservoir to 330 cfs, with a target April-1 reservoir content of 120,000 ac-ft. Based on data available in the middle of September, winter outflow of around 425 was anticipated. As it turned out, by December 1, the reservoir was around 17,000 ac-ft short of the mid-September prediction and well outside of the 90% prediction interval. So, how did reservoir fill rate fall so far short, and why were my projections so far off?
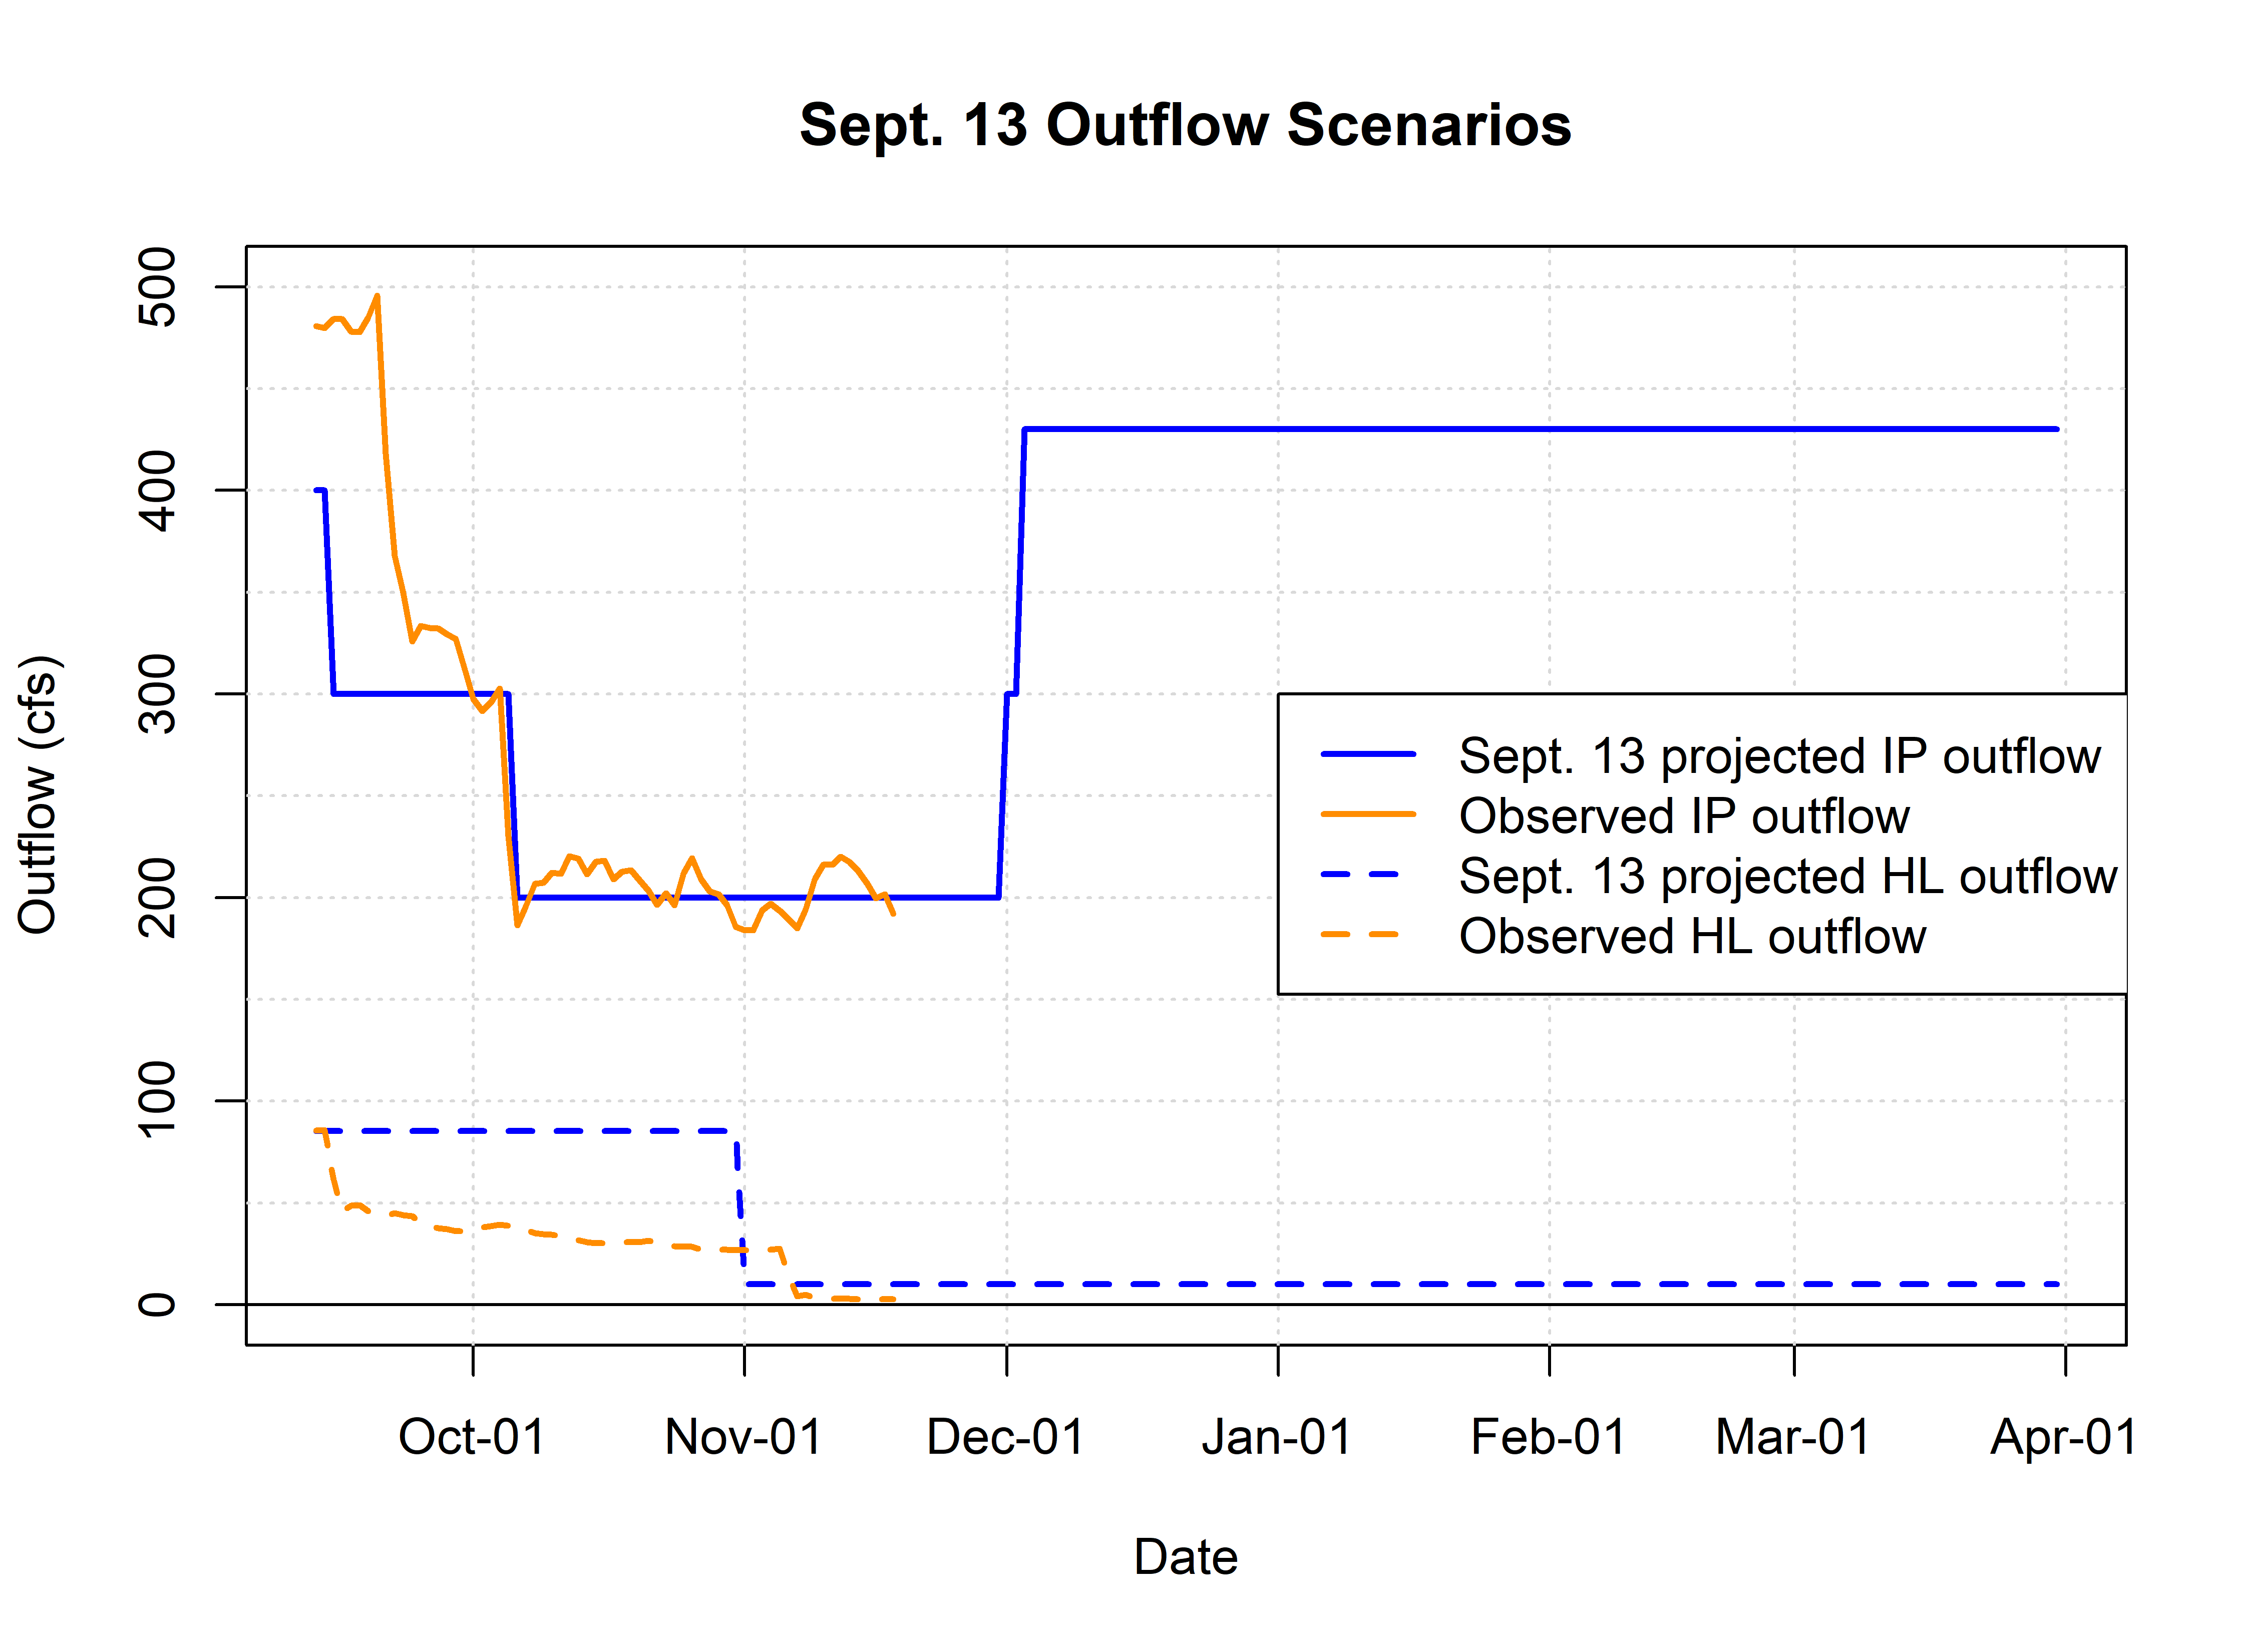
The reservoir reached its minimum on September 9 and started to fill at that time. Based on data available in mid-September, when the Drought Management Planning Committee met to set winter flow strategy, inflow between Henry’s Lake and Island Park was expected to be 96% of average. At that time, the planned operation was to lower outflow from Island Park Reservoir to 300 cfs as soon as possible after the meeting and then reduce outflow to 200 cfs on October 5. Further, I had assumed that outflow from Henry’s Lake would be maintained at its early-September value of 80 cfs well into the fall. However, outflow from Island Park was not reduced to 300 cfs until September 24 and outflow from Henry’s Lake was reduced on September 15, as can be seen in the following graph.
Both of those departures from my initial model assumptions were required because of very dry conditions, and I did not include any possibility of deviating from those outflow assumptions. The two sources of uncertainty included in my mid-September predictions were precipitation and natural flow. Natural flow turned out to be 84% of average during the early part of the fall, vs. my predicted value of 96% of average. However, after accounting for the difference between actual and modeled reservoir outflow, the model adequately accounted for uncertainty in precipitation and natural inflow, and the resulting reservoir content would have fallen well within the statistical prediction interval. The lesson for me was that accounting for variability in natural systems is much easier than accounting for variability in human systems, which in this case include things like diversion and date on which reservoir adjustments are made. Nonetheless, I will try to incorporate uncertainty on the human side in future models.
The 17,000 ac-ft shortfall in December 1 reservoir content relative to my mid-September prediction is the sum of three components that were all short of the prediction: 3,500 ac-ft of Island Park inflow from Henry’s Lake outflow, 4,800 ac-ft of Island Park outflow in excess of expectation, and 8,700 ac-ft of Island Park inflow from lower-than-expected natural flow. Of course, the 3,500 ac-ft expected from Henry’s Lake was stored there, rather than in Island Park, so that water remains in the upper watershed and will benefit Island Park Reservoir next spring and summer. Had that not been stored in Henry’s Lake, the lake level would have dropped well below average this fall, jeopardizing fill. Mean annual watershed yield of the Henry’s Lake basin is only half of the lake’s capacity (i.e., it takes two years of inflow to fill the lake), so Henry’s Lake can’t be allowed to drop much below 85% full without risking a shortfall the following spring. Even with the reduction in outflow from around 80 cfs to 30 cfs made in mid-September, Henry’s Lake continued to draft until early November.
As for the higher-than-expected September outflow from Island Park Reservoir, recall that diversion was above average from early September to mid-October. After the drop in Island Park outflow from 680 cfs to 490 cfs on September 9, flow targets on the lower Henry’s Fork and lower Teton River were just barely met and continued to constrain operations at Island Park for several more weeks. Net diversion between September 13 and October 1 was 6,054 ac-ft above average. This was somewhat offset by lower-watershed reach gains that totaled 3,052 ac-ft above average, but most of the reach gains occur downstream of all of the points of diversion. So, above-average diversion easily accounts for the need to release 4,800 ac-ft more from Island Park Reservoir during late September than I had anticipated on September 13.
So, with a 17,000 ac-ft shortfall relative to what I had projected and expected winter inflow at 84% of average instead of 96% of average as predicted back in September, the only way to achieve the 120,000 ac-ft April 1 fill target from here is to release 330 cfs from the reservoir starting on December 1 instead of the 425 cfs we had hoped for. Relative to average, however, summer and fall management still put us well ahead of where we would have otherwise been right now.
Minimum reservoir content last September was 15,398 ac-ft better than average, and even with the 17,000 ac-ft shortfall, fall operations this year still filled an additional 1,472 ac-ft more than average fall operations. Together, this advantage in reservoir content going into the winter is worth 70 cfs of winter flow above the long-term average. Unfortunately, well below average natural flow will reduce outflow by around that same amount—around 70 cfs. Lastly, mean April-1 reservoir content is a little over 112,000 ac-ft, and this year’s target is 120,000 ac-ft. That difference is equivalent to around 30 cfs lower winter flow, relative to average. The table below summarizes fall and winter fill this year, in comparison with 1978-2020 averages.
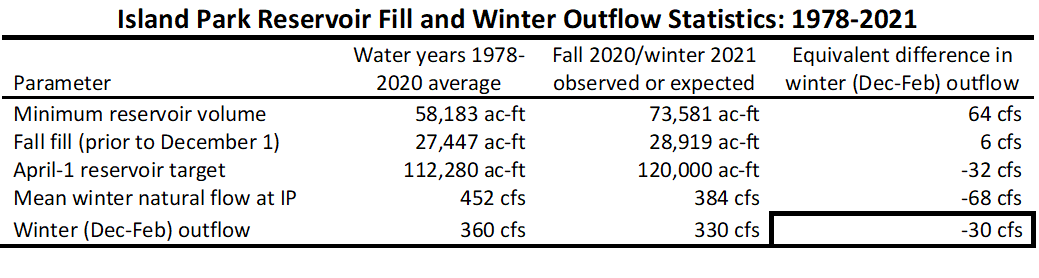
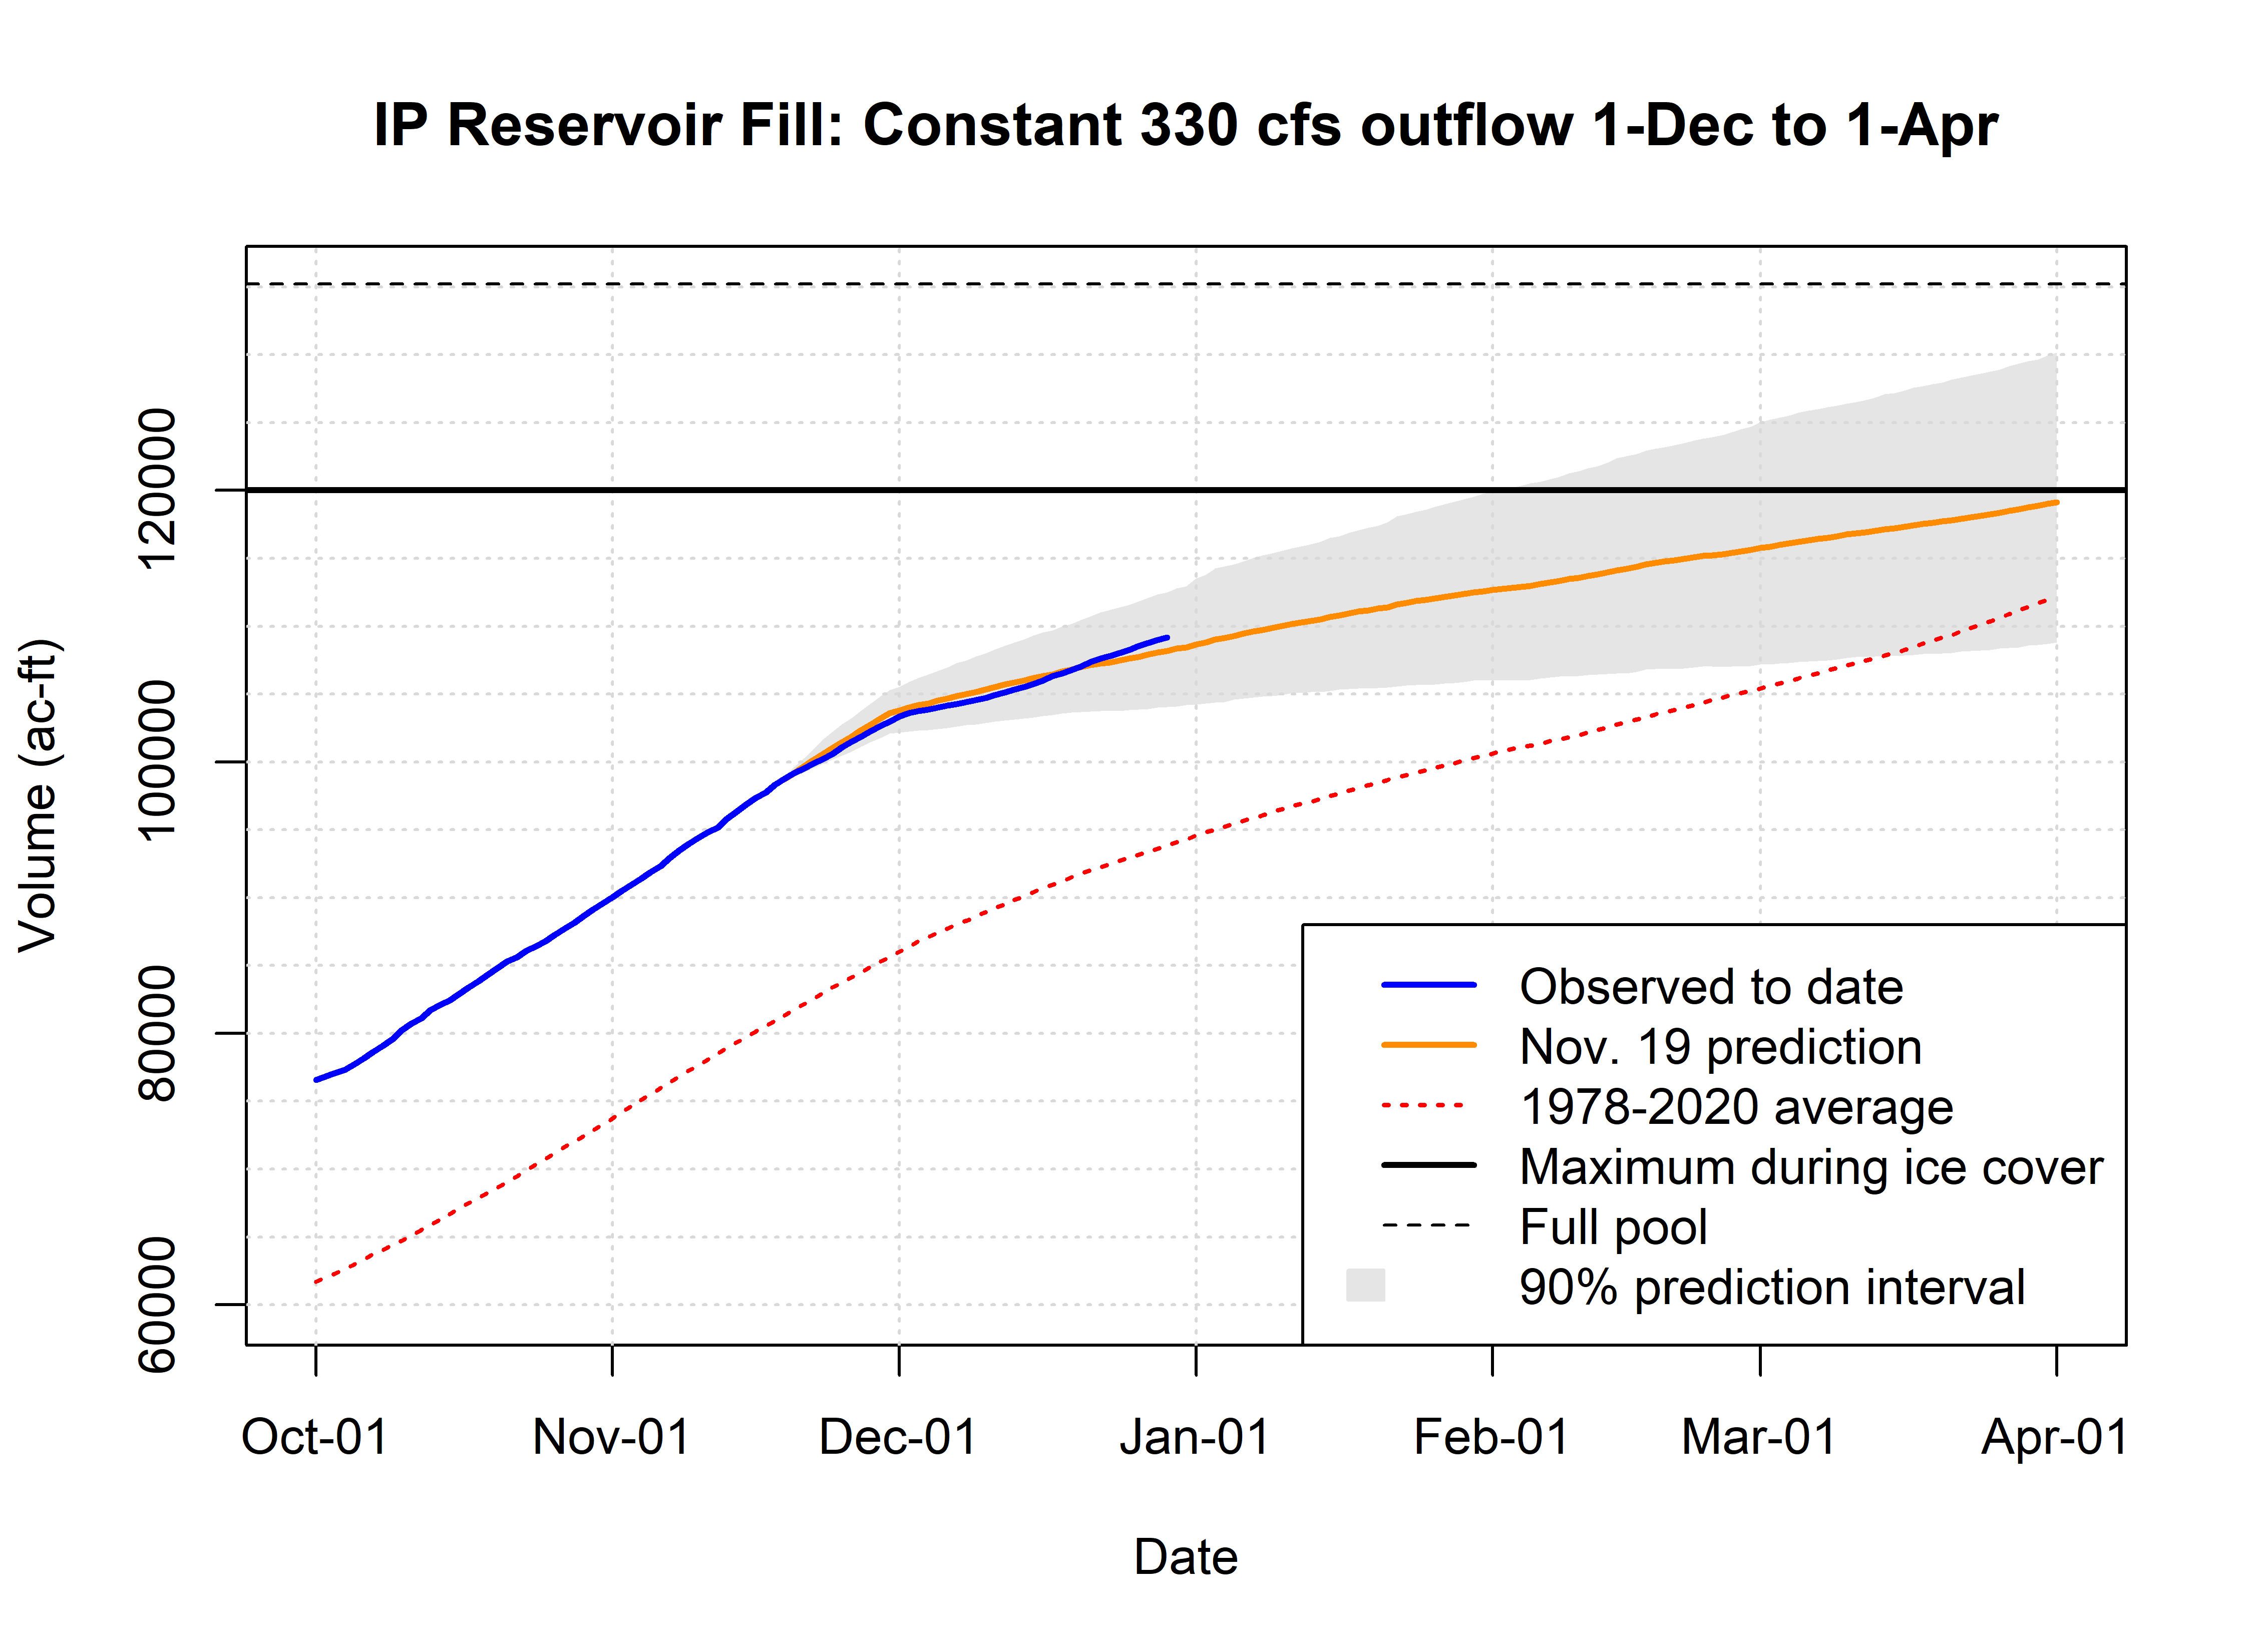
So, with the 1978-2020 average winter outflow at 360 cfs, the 30-cfs difference puts us at the current target of 330 cfs. As of today, December 30, winter flow to date has averaged 346 cfs by the official USGS record, and reservoir fill has closely tracked my mid-November projection, as can be seen in the graph below. Note that fill rate was lower than predicted during the first two weeks of December, which were very dry. However, due to increased precipitation over the past two weeks, fill rate has increased, and reservoir volume is now around 1,000 ac-ft ahead of my projection.
Long-term trends in winter flow
Mean winter (December-February) outflow from Island Park Reservoir since 1978 has been increasing over the past few years, as very high winter flows are averaged into the record. Mean winter flow was 347 cfs after the 2017 winter, 351 cfs after 2018, 356 cfs after 2019, and 360 cfs after 2020. So in some ways, the Drought Management Planning Committee is a victim of its own success: precision reservoir management during all seasons of the year has increased the average from 347 cfs to 360 cfs in only four years, making it harder to continue to meet average! Put another way, this year’s anticipated outflow of 330 cfs would have been 95% of average four years ago but is now only 92% of average. Furthermore, even with this winter’s below-average flow, the three-year average (relevant because a rainbow trout generation is three years) is higher than it has been since 2001, which you can see in the graph below.
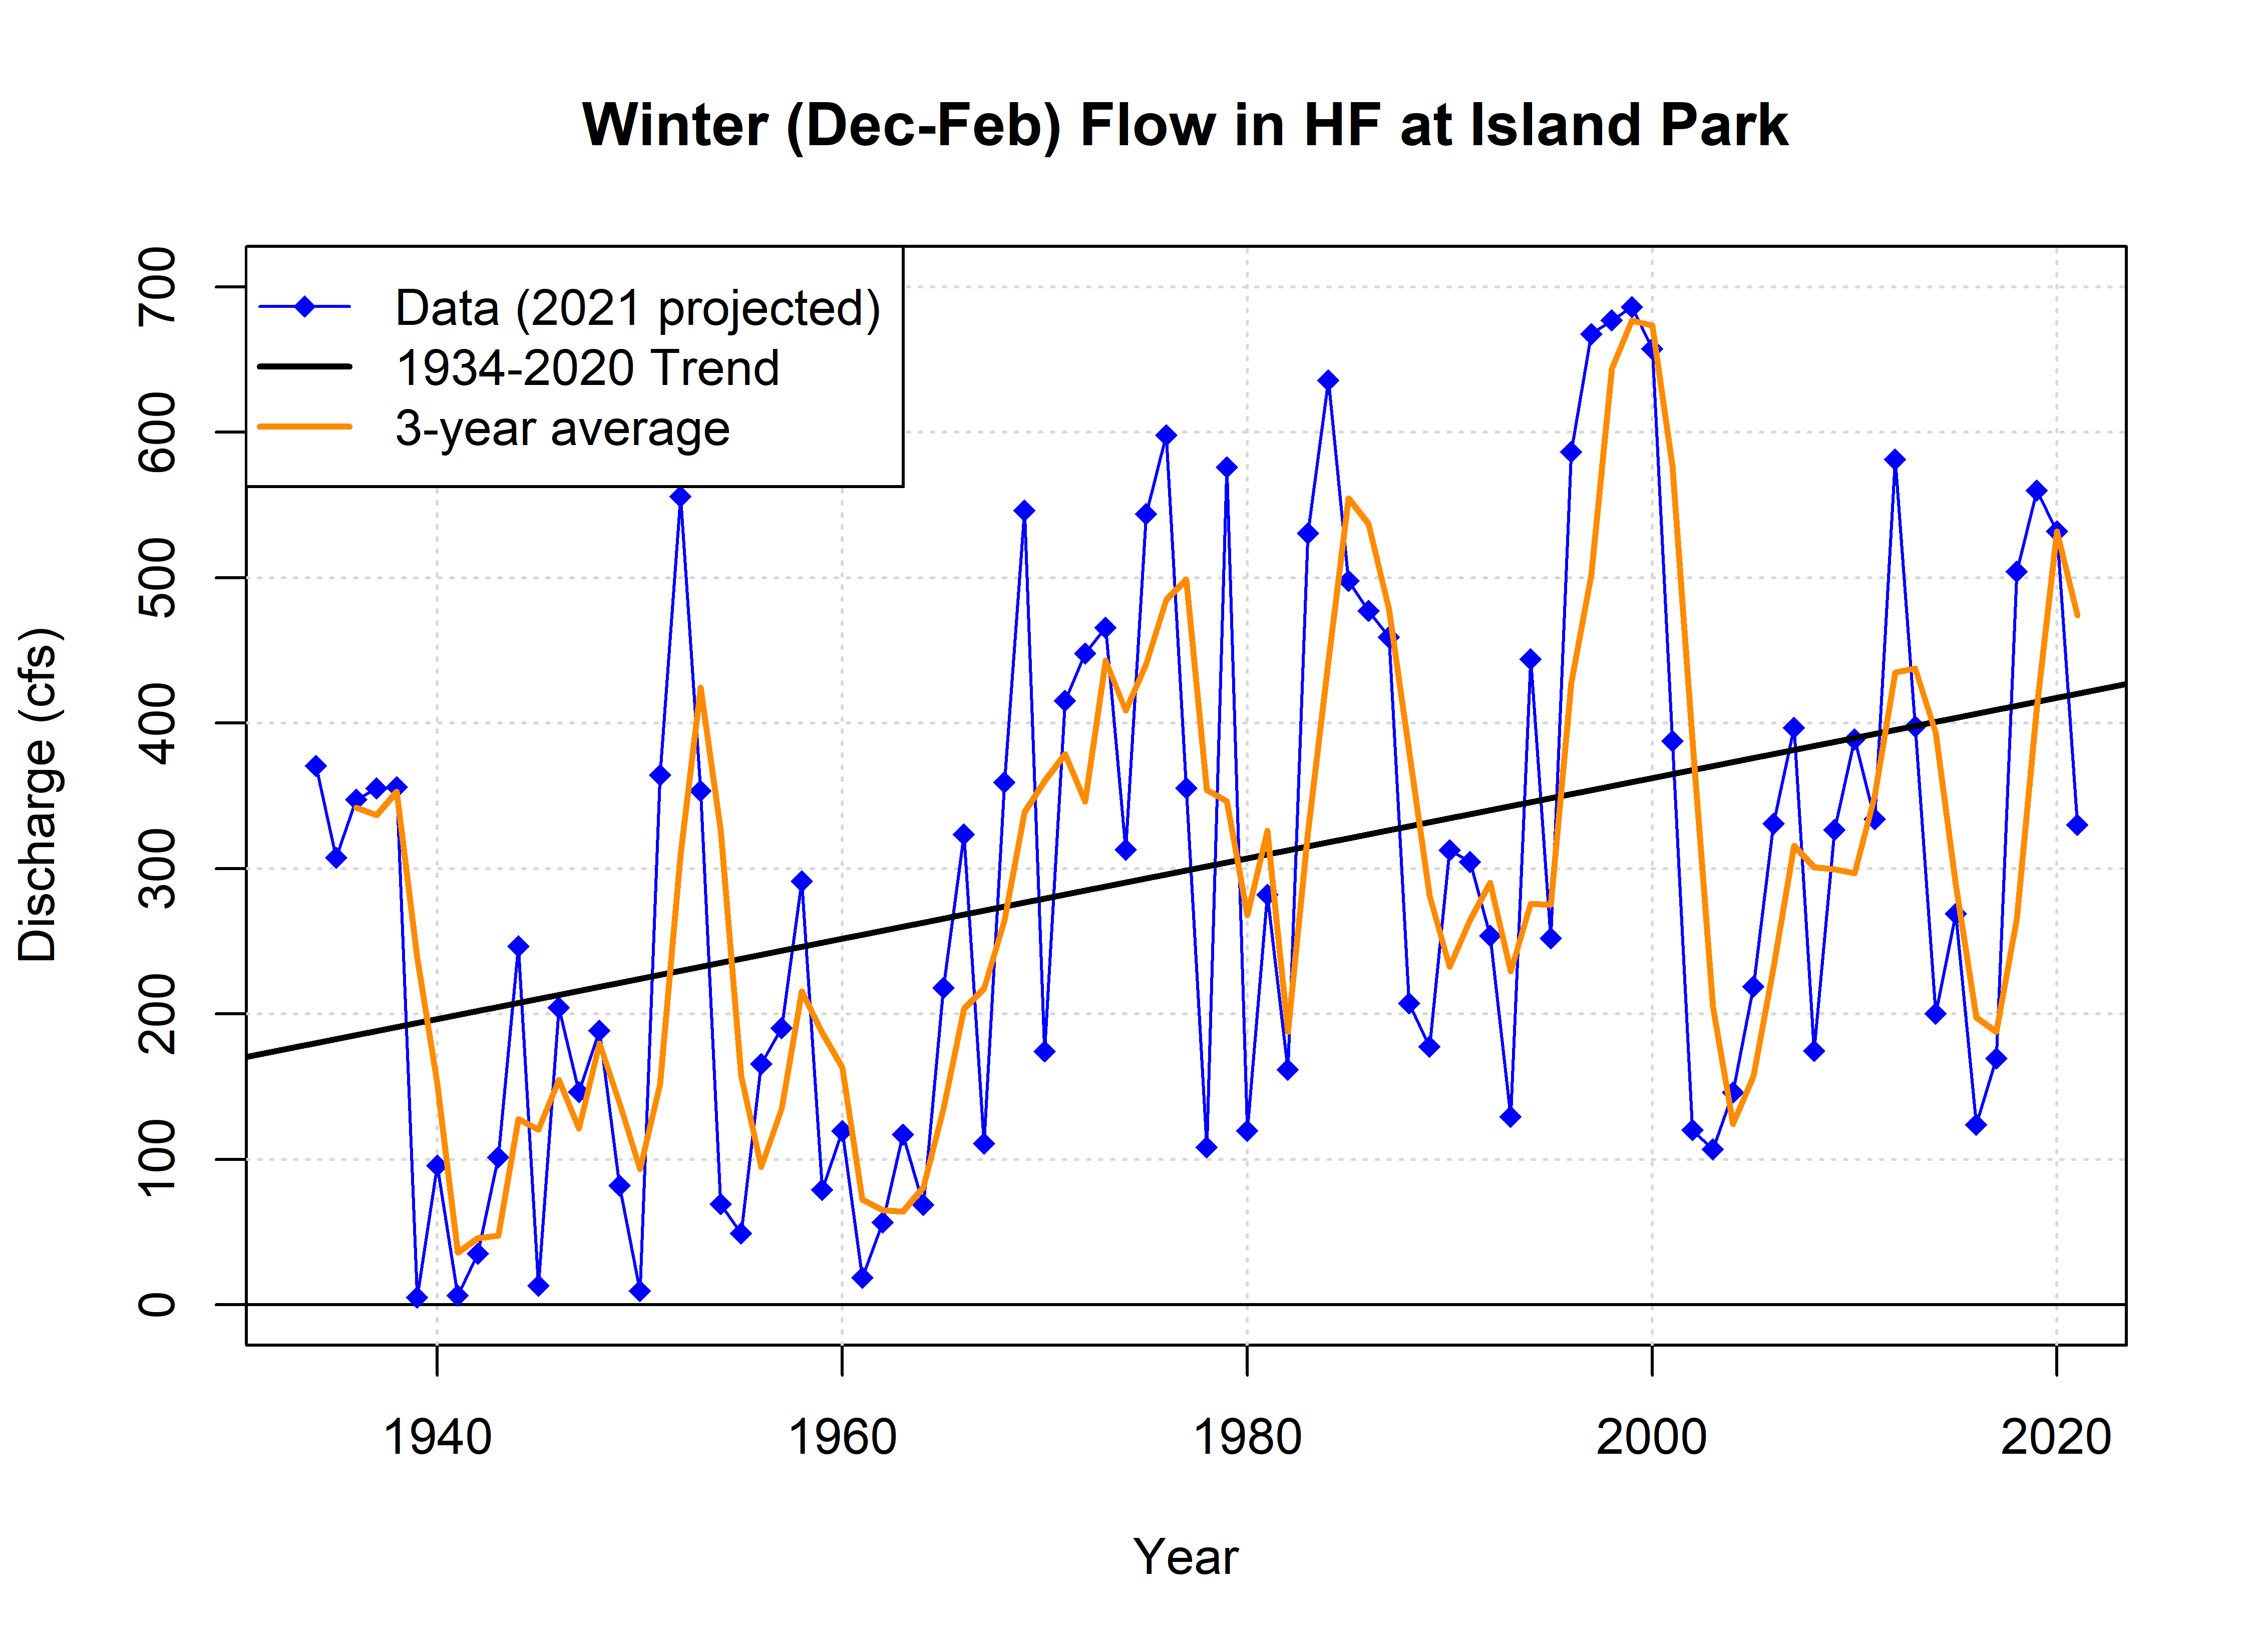
The graph above shows that winter flow has been on an increasing trend since the dam was built. The first five data points are from years prior to completion of the dam. Notice that winter flow during those years was in the range of 300-375 cfs, about where this year’s flow will come in. Those were the driest years on record (other than 2016) at Island Park, so winter flow was low even without a reservoir to fill. You can also see numerous years between dam completion in water year 1939 and the mid-1960s when winter flow was essentially 0. The improvement made in the 1970s to provide more winter flow for hydroeletric power generation is also apparent. Of course, the upward trend can’t continue forever, but as we continue to work with our partners to improve water management system-wide, winter flows of 400 cfs or greater will become more common, and flows in the 100-300 cfs range will become less common.