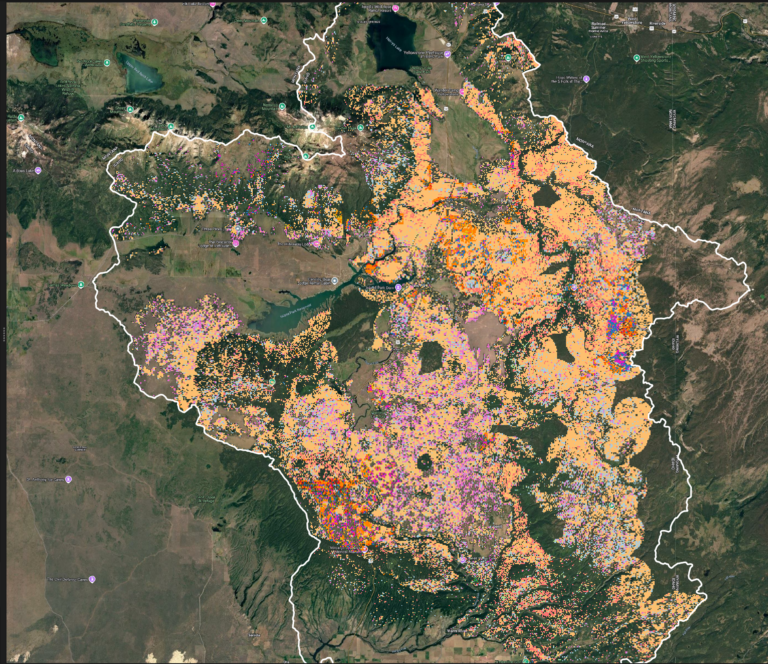
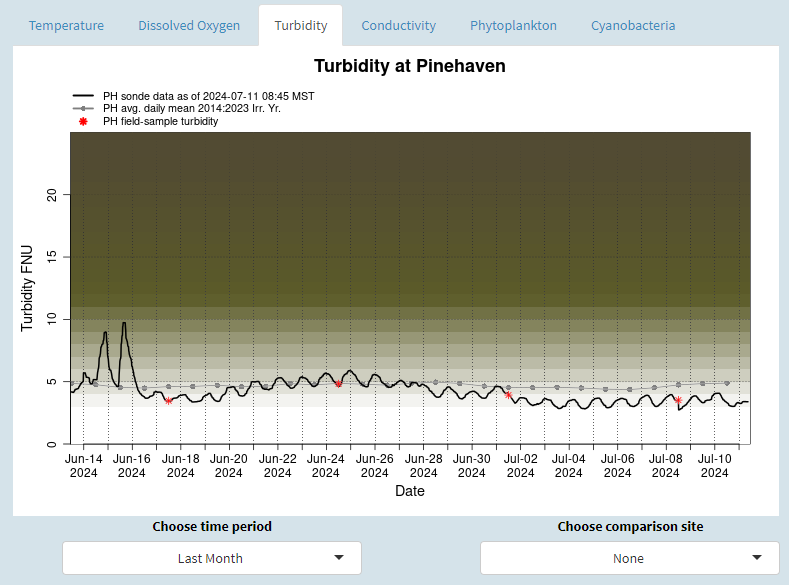
 Turbidity at Pinehaven from June 13 to July 11, 2024
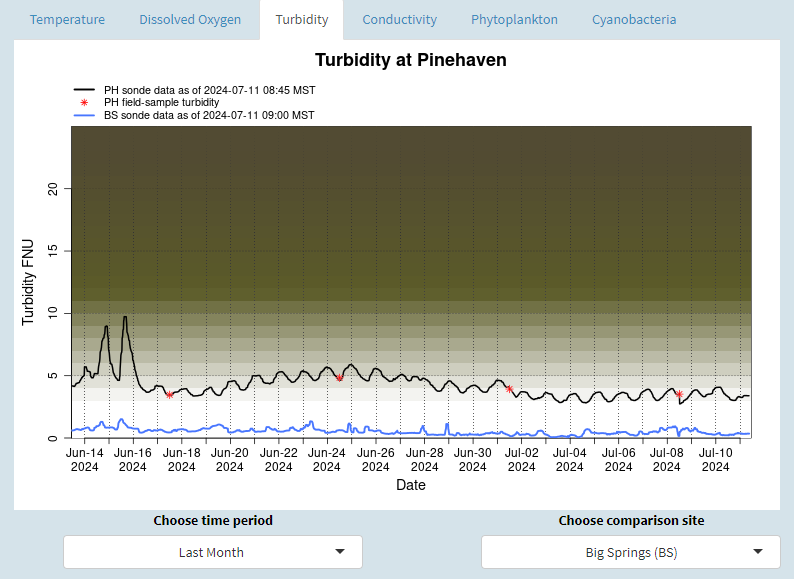 Comparison of turbidity/water clarity at Pinehaven (in black) with Big Springs (in blue) for June 13-July 11, 2024.

General
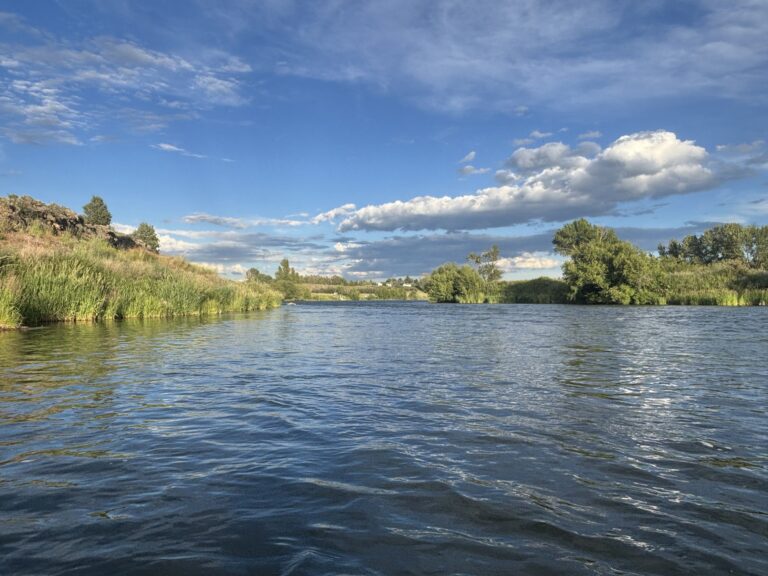
SUMMER ON THE SOUTH FORK
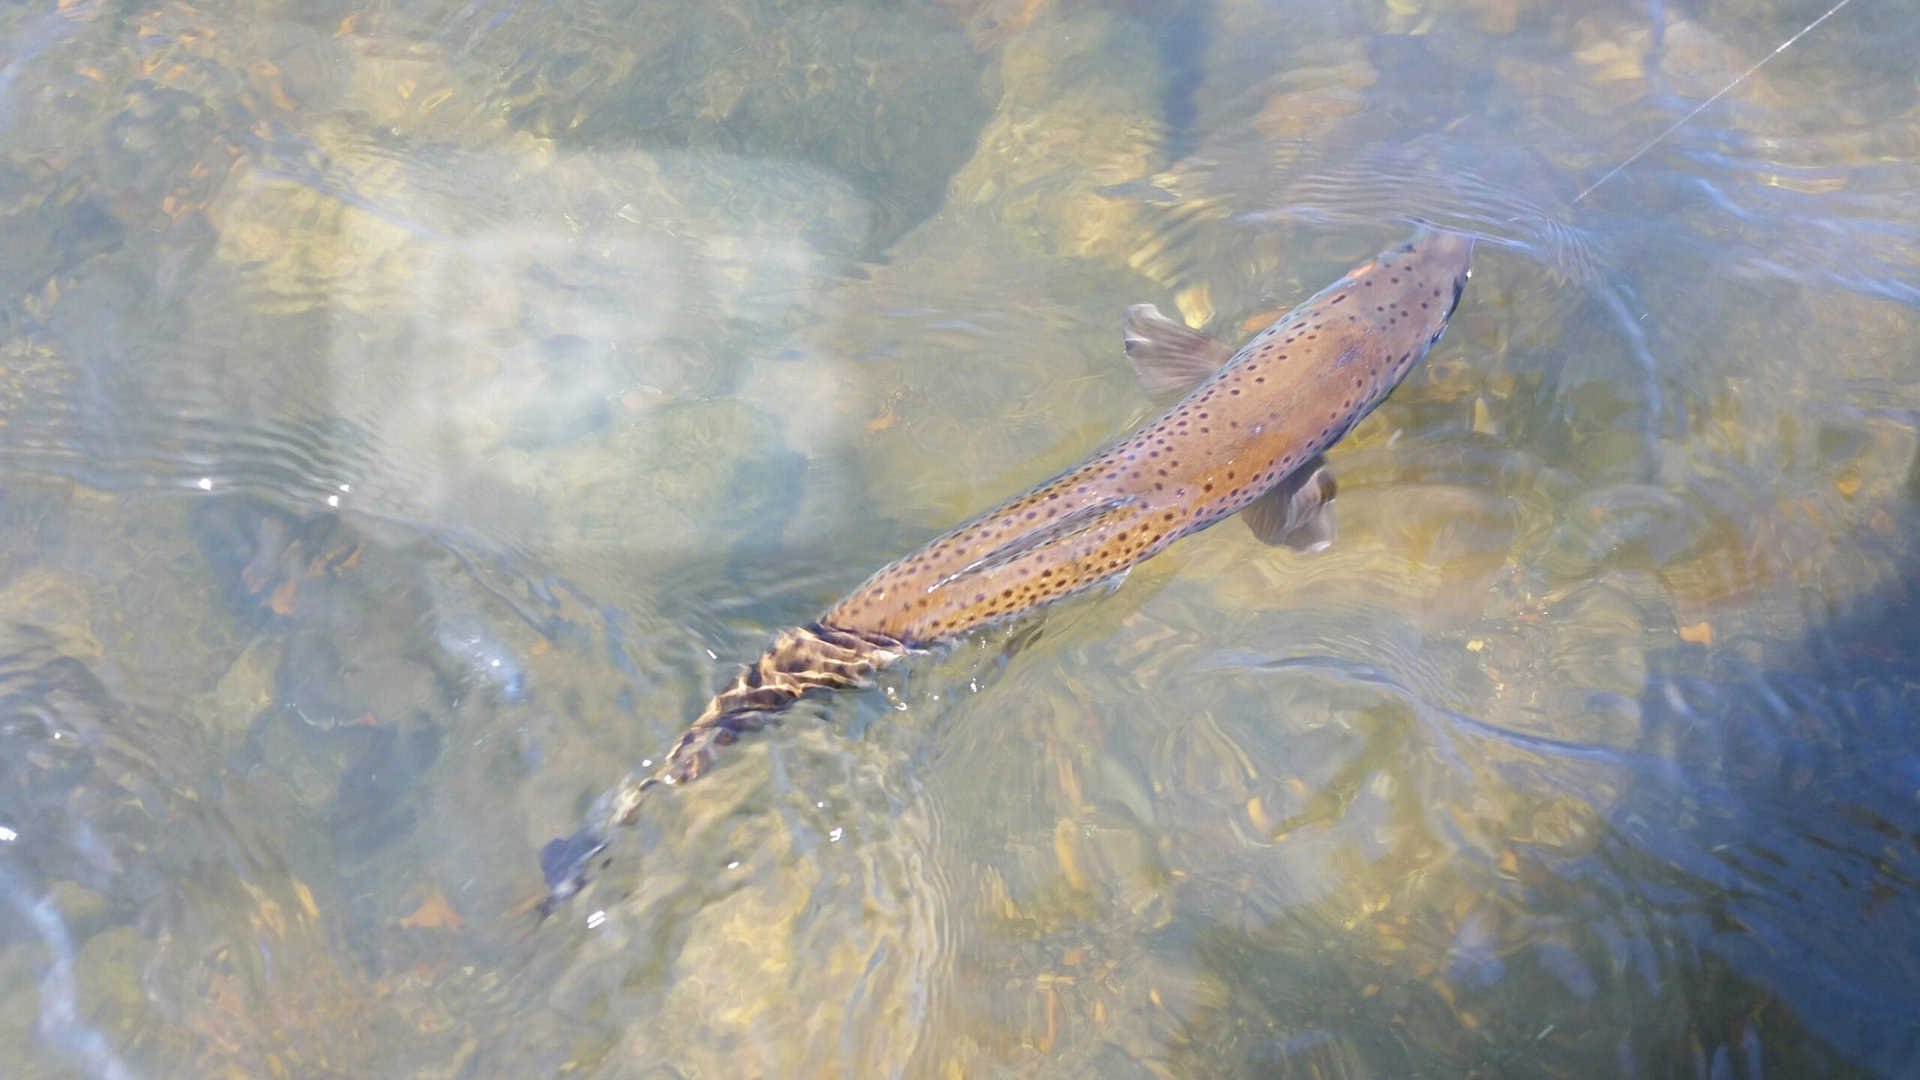
It’s no secret that the Henry’s Fork is a river of grandeur. To those that fish it, it is like a church – a sanctuary that breathes fly-fishing legend. However, the South Fork quietly rumbles in the distance, with striking beauty, and equally legendary status. The South Fork’s deep, ripping currents, and plugging canyon walls hold many anglers fish of a lifetime. However, beyond trout fishing, it is the community deeply rooted in the waters