How Does HFF Calculate Hatch Timing?

Home » Blog » How Does HFF Calculate Hatch Timing?
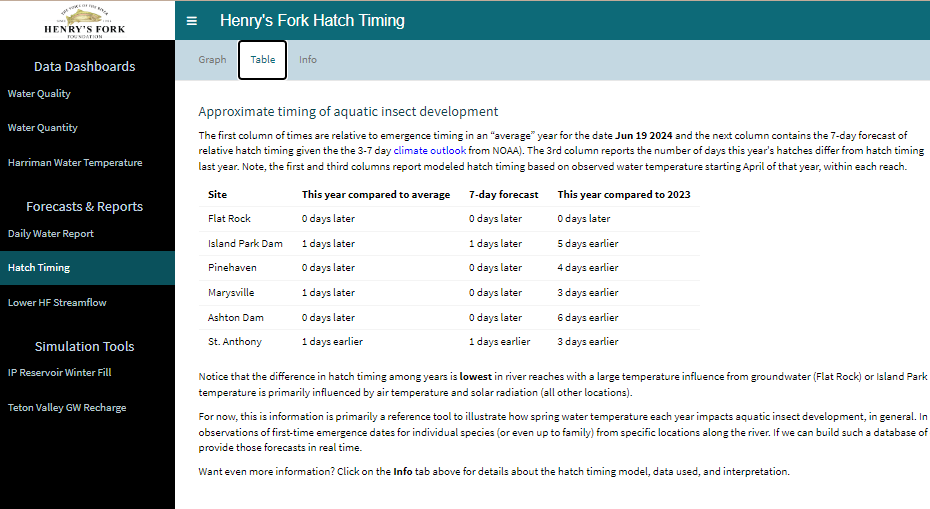
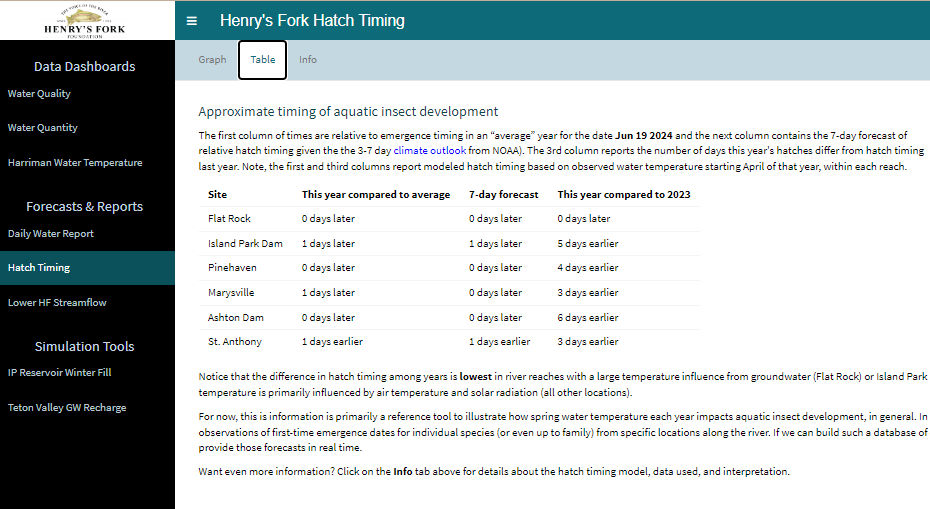
Hatch Timing Table

Rather than a typical “hatch chart”, HFF’s hatch timing calculations are based on accumulation of thermal units in the aquatic ecosystem. Different species hatch after accumulation of a given number of thermal units, with earlier hatching species requiring fewer and later species needing more (i.e. a species requiring 100 degree days will hatch earlier than one requiring 200 degree days). Also, warmer water temperatures allow accumulation of thermal units to happen quicker. Using thermal units as a gage allows us to predict timing compared to average.

So, we report the number of days difference between average accumulation of thermal units and what has actually happened based on water temperatures since the beginning of the aquatic growing season (approximately April 1st).

For example, when we report hatch timing is “within 1 day of average”, that means that all of the species that normally hatch around this time of year will be hatching at roughly their normal time. And “average” is based on the aquatic insect data we have, spanning 2014-2024.

Our next step is to scientifically compare these calculations with insect observations in the field, which will require a massive sampling effort and 3 or 4 years of field work. To be continued.

To view HFF’s Hatch Timing website, click below.

Hatch Timing Website

To learn more about HFF’s expansive aquatic insect monitoring program, AIM for Healthy Rivers, click below.

Insect Monitoring Program

Facebook
LinkedIn
Pinterest

Recent Posts

An aerial view of Island Park Dam. The reservoir sits behind it and the river flows below it.
Water Quality
Christina Morrisett

Summer 2026 Water Quality Forecast for Island Park

This article was originally published in Island Park News on May 29, 2026 Ice melted on Island Park Reservoir on March 31, 2026—four weeks earlier than normal and the earliest the Henry’s Fork Foundation (HFF) has observed in 12 years of monitoring. Such an early ice melt was not unexpected given the region’s near-record warm and dry winter. But ice melting a month early has implications for water quality in Island Park Reservoir and the

Read More »
Aerial photo of Island Park Reservoir. The dam is in the bottom left corner. The Centennial Mountain Range is in the top.
Research and Monitoring
Christina Morrisett

History of Water Quality in Island Park Reservoir

Warmer and drier conditions have slowly degraded water quality in Island Park Reservoir over the last 50 years.  In the 1970s and 1980s, federal reports and university research indicate that the reservoir had relatively good water quality. Island Park Reservoir was mesotrophic—with mostly clear water and occasionally low dissolved oxygen at the reservoir’s deepest depths during the summertime. But, as time went on, water quality began to decline. Historical satellite imagery analyzed by the U.S.

Read More »
A photo taken of Island Park Reservoir while standing on the dam and looking north. The sky is cloudy, Mt Sawtelle sits with little snow in the background, and the reservoir is open water (save for a few small sheets of ice in the distance).
Frequently Asked Questions
Christina Morrisett

Reservoir Ices Off, Growing Season Turns On

Photo of an ice-free Island Park Reservoir taken on March 31, 2026 On March 31, 2026, with no accompanying commentary, HFF scientist Christina Morrisett stood on top of Island Park Dam and texted colleagues Rob Van Kirk and Jack McLaren photos of open water on Island Park Reservoir. Rob, eager to see that the reservoir reality matched what he was seeing in the real-time river data downstream, texted back, “Yep! That’s close enough to ice

Read More »
Photo of confluence of Warm River and Henry's Fork
Fisheries
Rob Van Kirk

Water Supply and Water Quality Predictions for Summer 2026

The photo above captures the unprecedented situation we face at the beginning of April. The photo, of the confluence of Warm River and the Henry’s Fork, was taken on February 7 and shows the shocking lack of snow we experienced in the watershed all winter as a result of record-breaking warm temperatures. How will the warm winter and lack of snow affect water supply, water quantity, and fisheries? The highlights are below. If you want

Read More »