This is the third installment of a five-part series investigating the various effects of receiving more precipitation as rain versus snow in the Henry’s Fork watershed. This installment was originally included in a daily water report sent March 6, 2024.
The big takeaway:
Water use and management in the Henry’s Fork watershed have much larger effects on streamflow than any changes due to changes in precipitation type.
The details:
Today’s message is specific to river systems such as the Snake River—including the Henry’s Fork—that are highly regulated by reservoirs, diversions, and irrigation return. The information I have presented the last two days centered around the natural watershed response to changes in precipitation type, and our ability to predict that response. However, in regulated systems, the streamflow experienced by fish and other aquatic organisms, anglers, and run-of-river hydropower operations depends on how water is used and managed for irrigation, not just on how much water is available and whether it originated as rain, snow or a combination.
In 2008, I was invited to be a plenary speaker at the Idaho Chapter American Fisheries Society meeting and asked to talk about the effects of warming temperatures and changes in precipitation type on streamflow in Idaho’s rivers. My primary message in that talk is my primary message today: in highly regulated river systems, the effects of water use and management on streamflow are much greater than any changes that are occurring or are expected to occur in the next several decades due to temperature or precipitation trends.
The evidence is pretty simple to present. I’m attaching two graphics today. The first compares the river’s natural flow (what would be present in absence of management and use) with regulated flow (what actually is in the river) at three locations on the Henry’s Fork: Box Canyon, Ashton Dam (Ora Bridge), and Parker (Red Road Bridge). The black curves and gray shading show average natural flow and the range of natural flow, respectively. The orange curves and orange cross-hatched polygons show average regulated flow and its range, respectively.
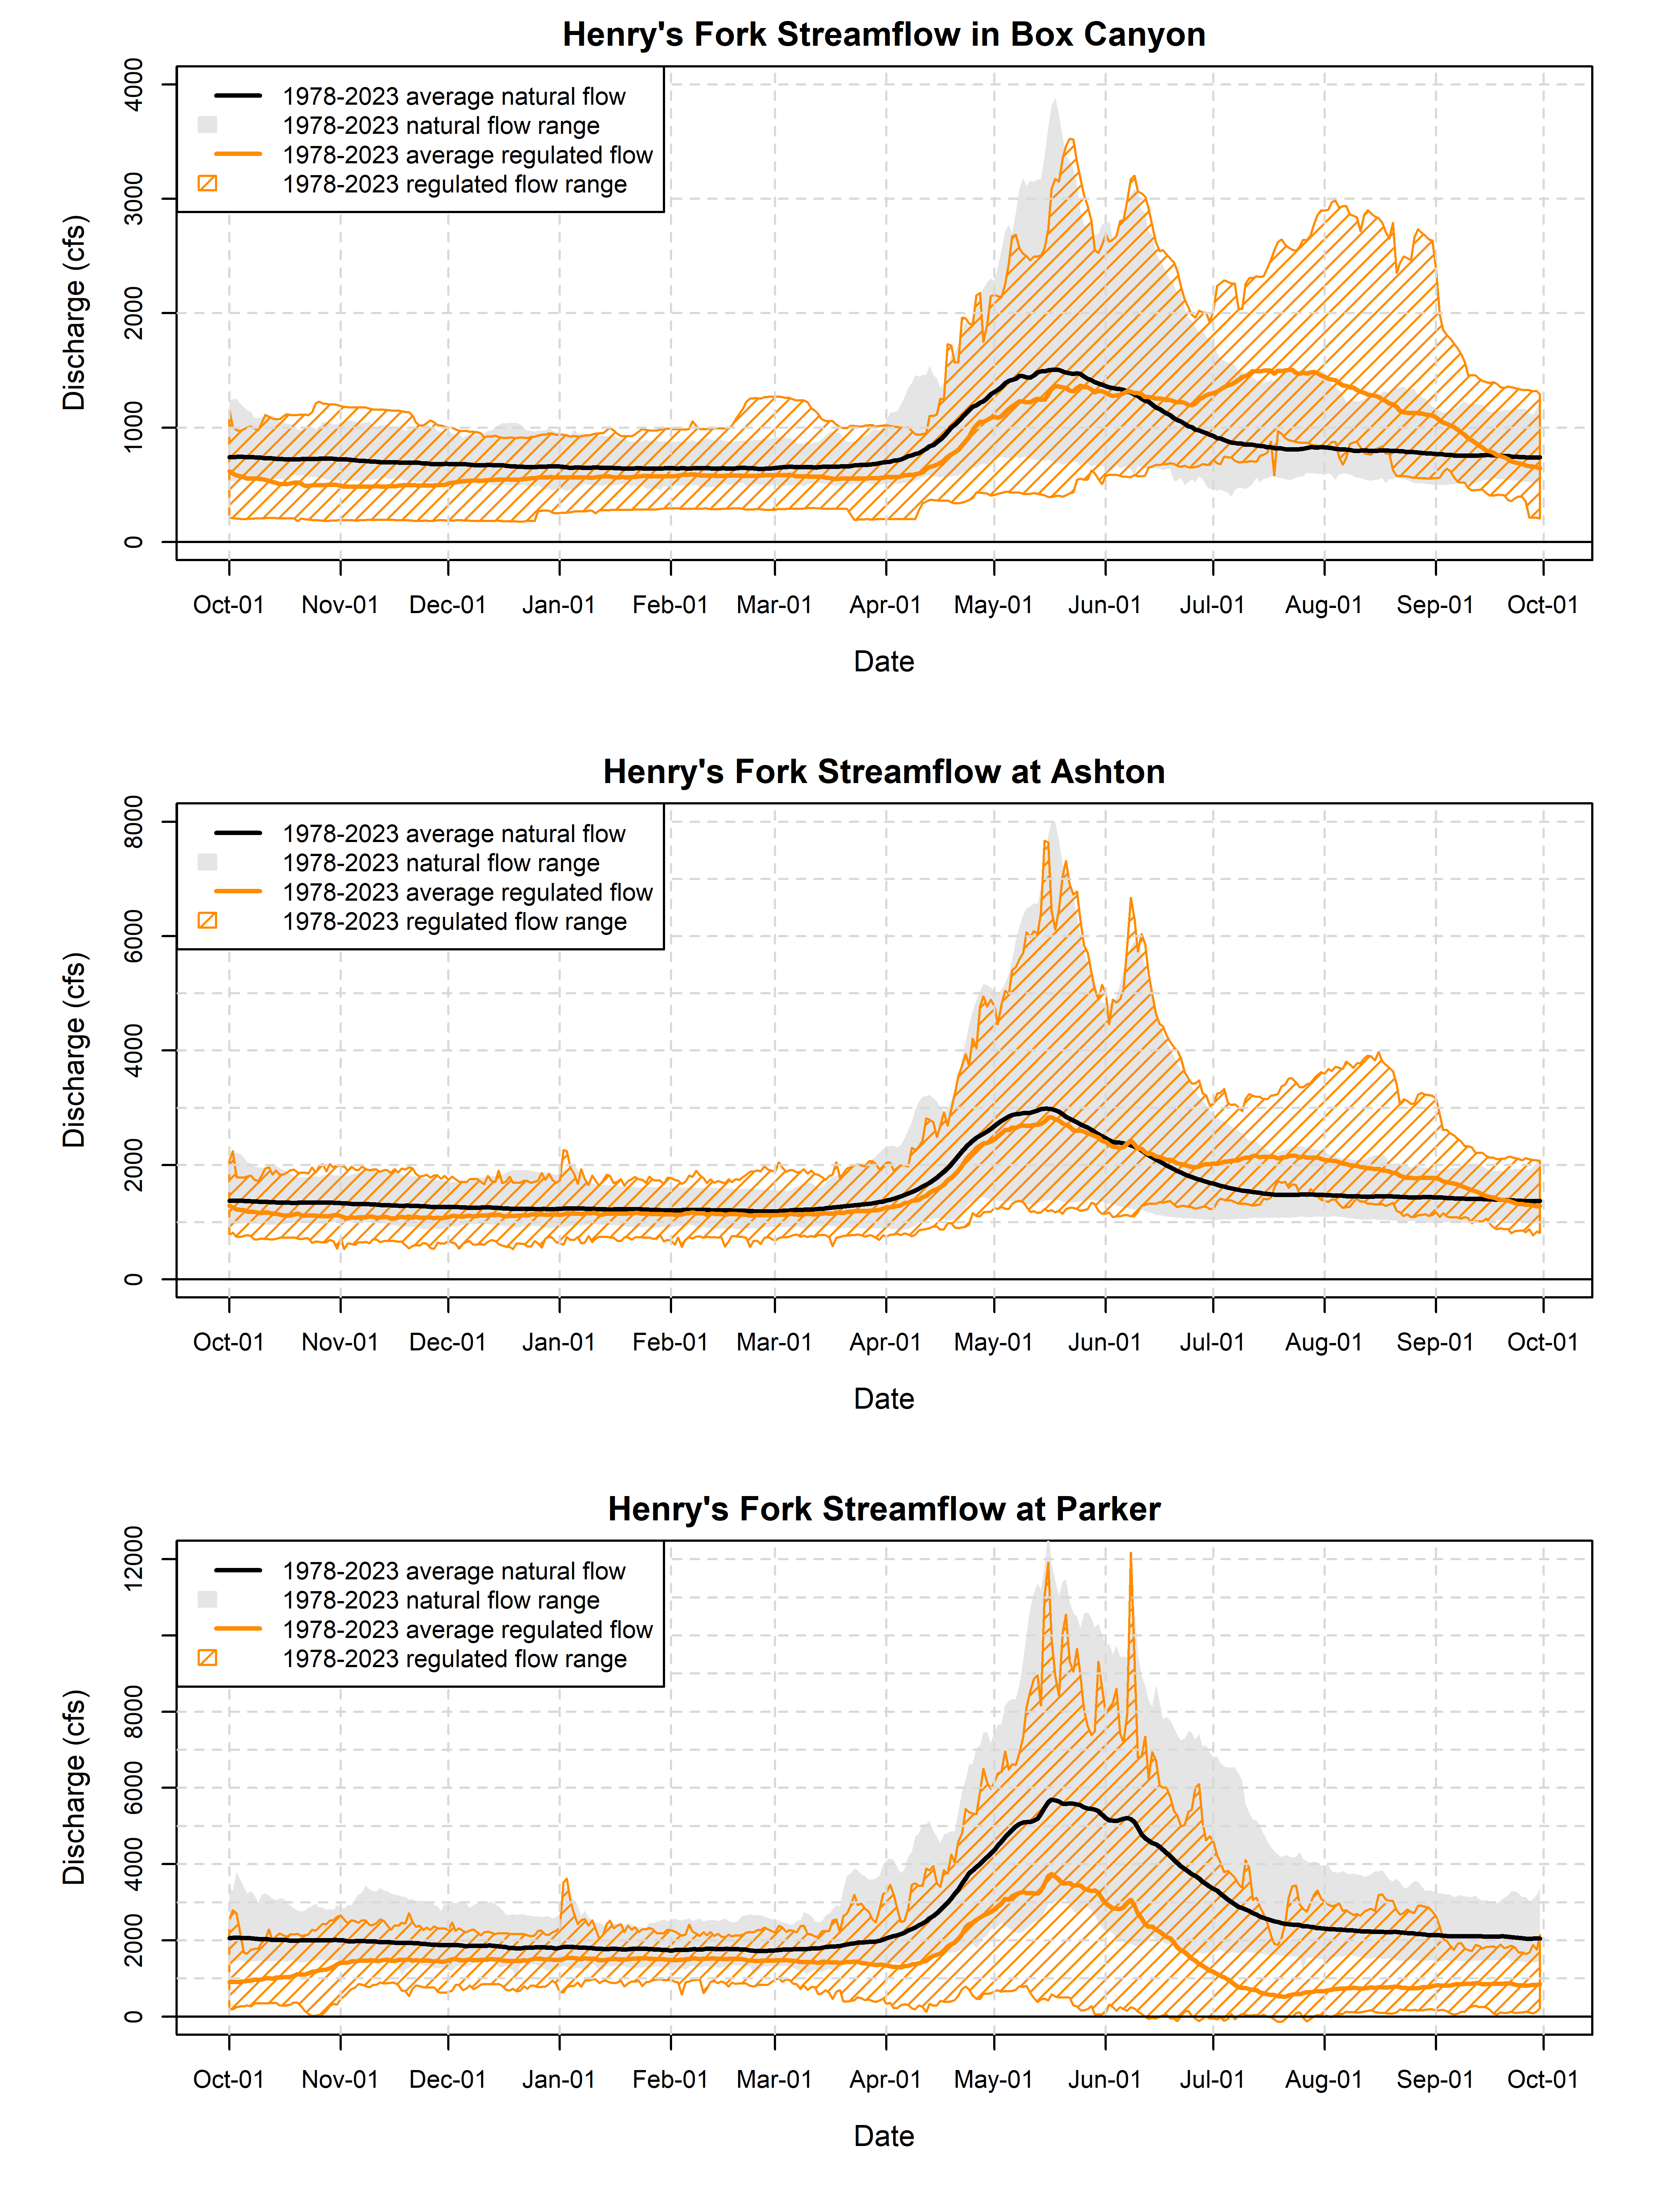
The first thing to observe in this graph is that the range of regulated flows (vertical extent of the orange polygons) is greater than that of natural flows. The latter reflects all of the natural flows that have been observed over the past 46 years, which includes the full range of snow vs. rain fractions I presented over the past two days. So, the variability in streamflow due to differences in climatic conditions experienced over the past 46 years is smaller than the variability in streamflow due to how the regulated system is managed within those climatic conditions. Note especially the high variability in regulated flows in Box Canyon during the winter and during July and August, and the very high variability in regulated flows during late spring and early summer at Parker.
The second thing to observe is that the average regulated flow at some times and locations falls at or even outside of even the most extreme observations of natural flow. For example, average regulated flow in Box Canyon during the winter is right at the minimum natural flow. This means that on average, regulated flow is equal to the minimum that would be expected in the natural system. Other examples are July-August flow in Box Canyon (average regulated flow greater than maximum natural flow) and July-October flow at Parker (average regulated flow less than minimum natural flow). Only at Ashton is the average regulated flow generally within the range of natural flows all year.
The second graph shows the relationship between regulated winter discharge from Island Park Reservoir as a function of the previous year’s natural flow (water supply) in the entire Henry’s Fork watershed. The curve shows a statistical fit to the data prior 2018, when HFF and its partners first implemented programs to conserve water on the farm and manage water more precisely. Not surprisingly, there is a strong positive relationship between water supply and winter flow out of Island Park Dam. When more water is available watershed-wide, less reservoir draft is needed, so less water needs to be stored in the winter to refill it. The six blue data points show winter flow in the six years since these water conservation measures were first implemented.

This graph makes two points. The first is the same point made above, namely that the effect of water management on streamflow is larger than the effect of natural variability. In particular, different management over the past six years resulted in winter flows that were 115 cfs higher than expected based on water supply; all six of those blue points lie above the curve rather than lie mixed in with the other points both above and below the curve. This illustrates that management can and does have a real effect on streamflow and can partially offset the effects of water supply.
The second point is that the interaction of management and natural water supply is greatest when water supply is lowest. This is illustrated by the curve getting steeper as water supply gets lower. In other words, the expected change in winter flow per unit of natural flow in the system is larger when natural flow is low. When water supply is high, the effect of storage and draft in Island Park Reservoir on streamflow is relatively low. The opposite is true when water supply is low.
The important things to take away from today’s information are: 1) the effects of water management and use on streamflow are greater than climate-related effects on natural streamflow, 2) the effects of water supply on streamflow in the regulated system are greater when water supply is lower.