Snow to Streamflow: A Story of Decline [Part 1]

Home » Blog » Snow to Streamflow: A Story of Decline [Part 1]
View of the mountains

Henry’s Lake mountains, photo credit Sarah Newcomb

Due to warmer growing seasons and denser forests, Henry’s Fork natural streamflow is declining and becoming less predictable.

Over the past 20 years, the Henry’s Fork has seen a decline in natural flow, or the amount of water that would flow down the river in the absence of any reservoirs or irrigation diversions (aka the water Mother Nature gives us). At the same time, we are starting to see rainier, less snowy years , meaning the total amount of water entering the watershed each year hasn’t changed, but less is falling as snow. So, how do we have the same amount of water coming in… but less becoming streamflow?

Where is the water going?

With funding from the National Science Foundation in 2023, Dr. Sarah Newcomb set out to answer this question as part of her dissertation research at Idaho State University. Sarah worked alongside the HFF Science and Technology Team to investigate how snowmelt and rain becomes streamflow in the Henry’s Fork. 

As a mountain hydrologist, Sarah studies how water moves through mountain systems. Water in the Henry’s Fork primarily starts as snow that falls high in three major tributaries: the upper Henry’s Fork, Fall River, and the Teton River. When rain falls and snow melts, the water enters the ground, saturates soils, recharges groundwater, and provides forests and plants with water. These underground processes can be hard to observe, but determine how much water is “leftover” for streamflow. This means that changes in streamflow indicate changes in these underground processes.

In this blog, we will dive into the processes contributing to the declining water supply. If you are interested in how we can characterize this change in predictive models, check out Part 2.

Part 1: Why is natural water supply declining?

Understanding a changing water supply requires considering a variety of climate and forest cover factors. In the western United States, some commonly cited reasons for streamflow decline include:

  • declining snowpack

  • declining total annual precipitation

  • less precipitation falling as snow

  • slower snowmelt

  • warmer temperatures

  • changes in forest cover

To understand the changes the Henry’s Fork is experiencing, we investigated these potential drivers using both on-the ground sensors and satellite data that provide more information about change across the landscape.

Using these datasets, we found that over the past 35 years, we have not seen significant changes in snow accumulation or total annual precipitation. However, when we looked at temperature data, we have seen significant May–September warming in the high elevation zones of the upper Henry’s Fork and Teton River subwatersheds where SNOTEL sites collect data. Late spring- and summertime warming increases atmospheric evaporative demand (also known as atmospheric thirst), which dries out the landscape and can lead to an earlier start of the growing season. Higher evaporative demand and longer growing seasons affect how much snowmelt becomes streamflow versus evapotranspiration (ET; how much water evaporates or is used by plants).

Streamflow is the “extra” rain and snowmelt that does not get returned to the atmosphere through ET or go towards deep groundwater recharge. Therefore, understanding changes in streamflow requires understanding changes in ET.

Changes in vegetation can also affect how much snowmelt goes towards ET. Using land cover data, we found that trees covered more of each subwatershed in 2020 than they did in 1989. This change in land cover is due to forest recovery following extensive disturbances including logging, fire, disease, and beetle infestations. The map below shows how tree cover has changed across the watershed with darker green colors showing areas with denser tree cover. As seen in the map, there has been the greatest forest change in the Upper Henry’s Fork.

tree cover graph

With large portions of the Henry’s Fork watershed experiencing warmer growing seasons and denser tree cover, it is no surprise that most of the forested regions of the watershed have seen significant increases in ET over the past 20 years.

Below you can see where there has been a significant trend in satellite-derived ET since 2002 (green). As with changes in tree cover, we see the upper Henry’s Fork has seen the strongest increasing trends. The following graph shows that there is a strong relationship between the average rate of ET in the Upper Henry’s and how much precipitation becomes streamflow. When ET is higher, less snowmelt and rain becomes streamflow.

So back to the original question, why is the natural water supply declining in the Henry’s Fork?

Key Takeaways:

  1. Water supply declines across the Henry’s Fork watershed are largely driven by changes in the upper Henry’s Fork.

  2. Due to warmer growing seasons and denser forests, ET is increasing. This means more water is evaporating and forests are using more water in the soil and groundwater.

  3. This increase in ET has led to less snowmelt and rain becoming streamflow.

Have questions or want to learn more about what we do at Henry’s Fork Foundation? Contact us!

Facebook
LinkedIn
Pinterest

Recent Posts

An aerial view of Island Park Dam. The reservoir sits behind it and the river flows below it.
Water Quality
Christina Morrisett

Summer 2026 Water Quality Forecast for Island Park

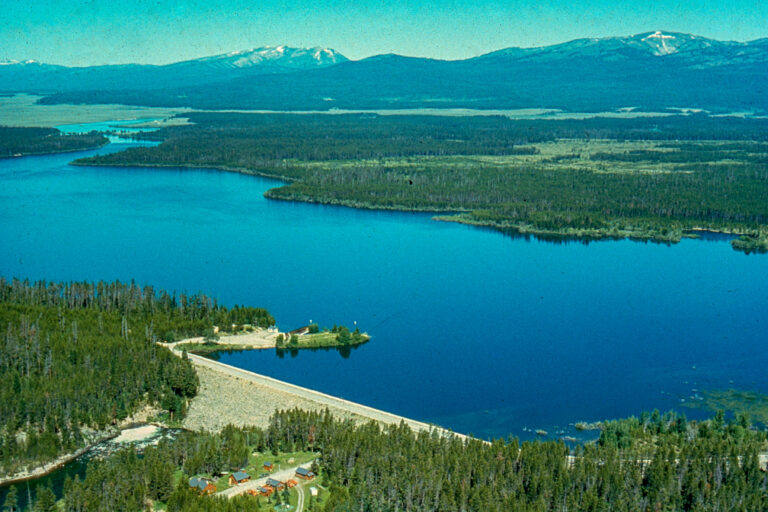
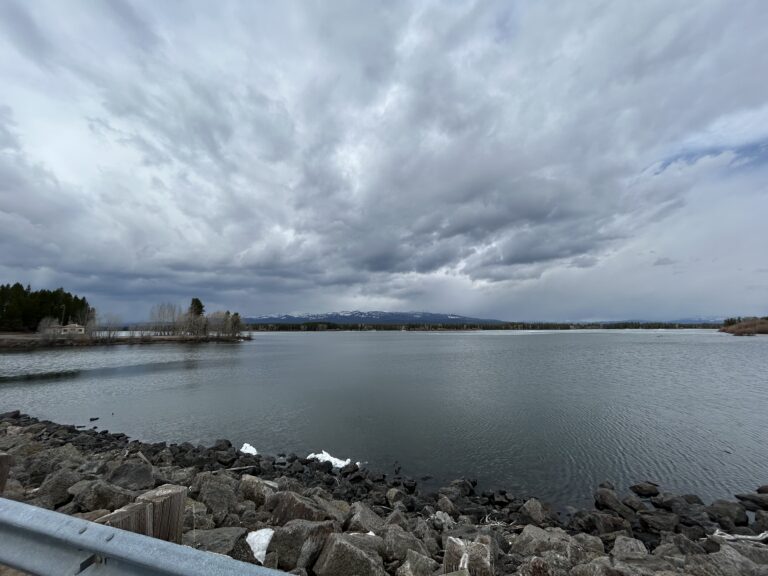
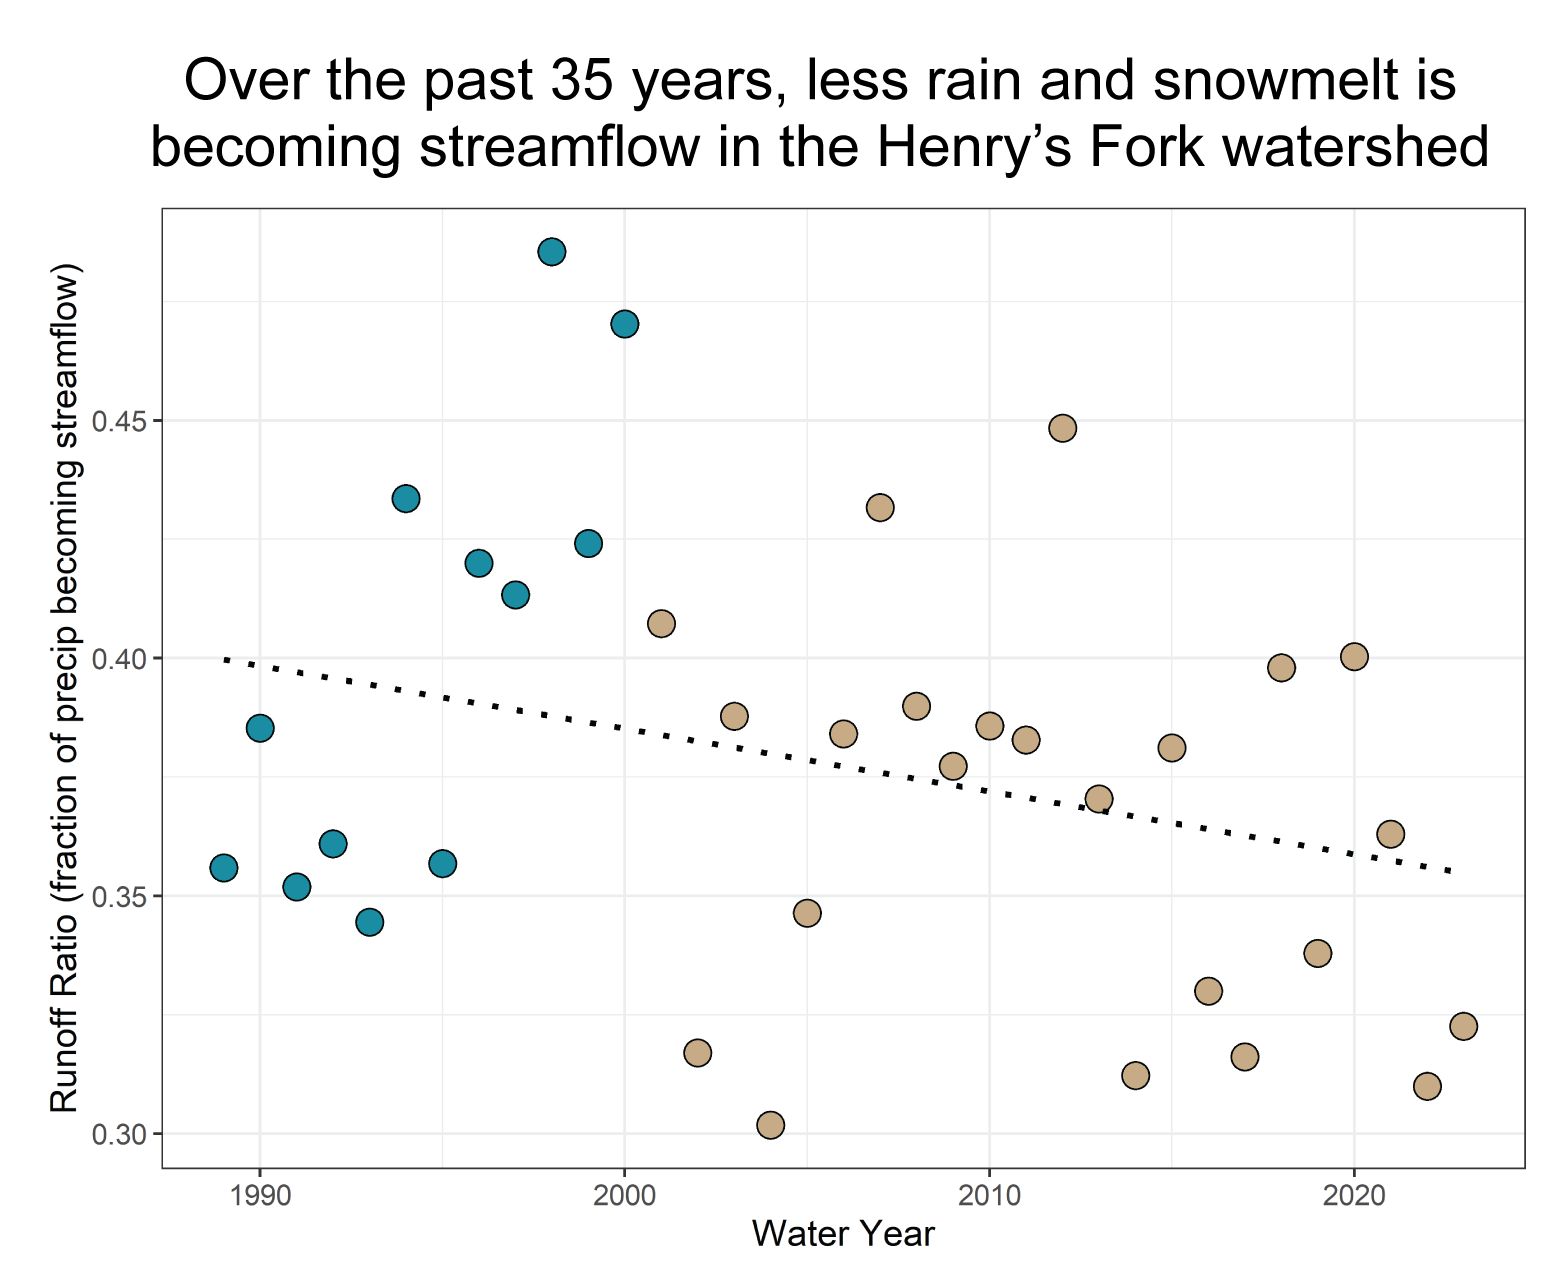
This article was originally published in Island Park News on May 29, 2026 Ice melted on Island Park Reservoir on March 31, 2026—four weeks earlier than normal and the earliest the Henry’s Fork Foundation (HFF) has observed in 12 years of monitoring. Such an early ice melt was not unexpected given the region’s near-record warm and dry winter. But ice melting a month early has implications for water quality in Island Park Reservoir and the

Read More »
Aerial photo of Island Park Reservoir. The dam is in the bottom left corner. The Centennial Mountain Range is in the top.
Water Quality
Christina Morrisett

History of Water Quality in Island Park Reservoir

Warmer and drier conditions have slowly degraded water quality in Island Park Reservoir over the last 50 years.  In the 1970s and 1980s, federal reports and university research indicate that the reservoir had relatively good water quality. Island Park Reservoir was mesotrophic—with mostly clear water and occasionally low dissolved oxygen at the reservoir’s deepest depths during the summertime. But, as time went on, water quality began to decline. Historical satellite imagery analyzed by the U.S.

Read More »
A photo taken of Island Park Reservoir while standing on the dam and looking north. The sky is cloudy, Mt Sawtelle sits with little snow in the background, and the reservoir is open water (save for a few small sheets of ice in the distance).
Water Quality
Christina Morrisett

Reservoir Ices Off, Growing Season Turns On

Photo of an ice-free Island Park Reservoir taken on March 31, 2026 On March 31, 2026, with no accompanying commentary, HFF scientist Christina Morrisett stood on top of Island Park Dam and texted colleagues Rob Van Kirk and Jack McLaren photos of open water on Island Park Reservoir. Rob, eager to see that the reservoir reality matched what he was seeing in the real-time river data downstream, texted back, “Yep! That’s close enough to ice

Read More »
Photo of confluence of Warm River and Henry's Fork
Water Quality
Rob Van Kirk

Water Supply and Water Quality Predictions for Summer 2026

The photo above captures the unprecedented situation we face at the beginning of April. The photo, of the confluence of Warm River and the Henry’s Fork, was taken on February 7 and shows the shocking lack of snow we experienced in the watershed all winter as a result of record-breaking warm temperatures. How will the warm winter and lack of snow affect water supply, water quantity, and fisheries? The highlights are below. If you want

Read More »